
Fig. 1.
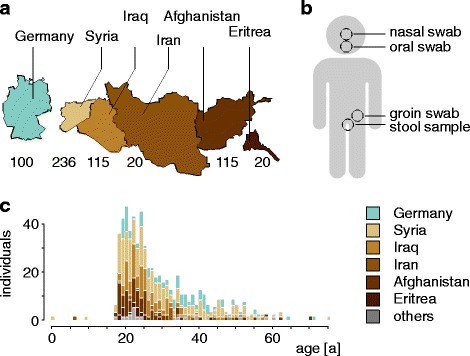
Cohort composition. a The number of individuals included in the study from different countries; countries with less than 20 individuals participating are not shown. b Different body sites sampled as part of the study. c Age distribution of the individuals included in the study, color coded by country. For better visualization, values were binned with 2 years per bin