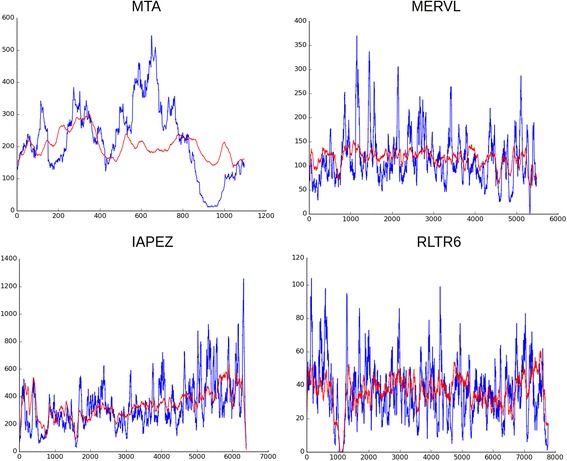
Fig. 3.

Reads coverage on mouse ERVs internal part consensus from Repbase. Blue line – reads from ChrmC. Red line – reads from wgHTS normalized on dataset size. X axis – consensus of ERV indicated in bp; Y axis – each read was mapped to the consensus and the coverage of each nucleotide indicated is shown
