Fig. 1.

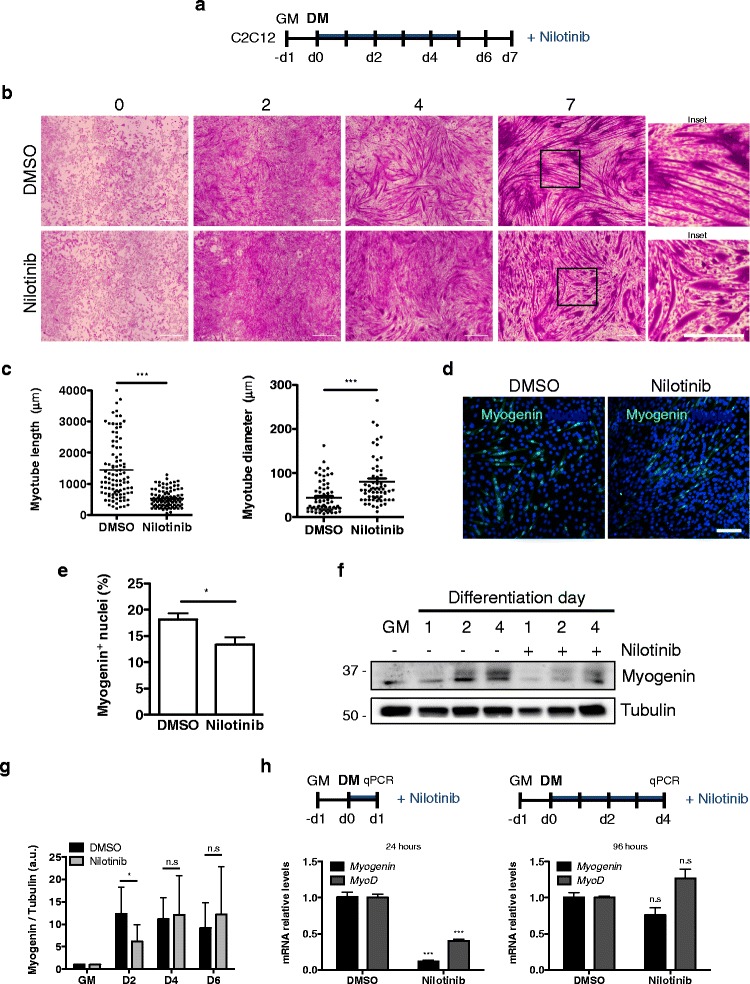
Nilotinib inhibits myogenic differentiation. a Outline of C2C12 skeletal muscle differentiation and Nilotinib (5 μM) treatment protocol. DMSO was used as control. b Representative crystal violet staining images of a differentiation time-course assay of C2C12 cells. Insets show a higher magnification of D7 myotubes. Scale bars: 500 μm. c Quantification (mean ± SEM) of myotube length and diameter at day 7 of differentiation. n = 3; ***P < 0.001; DMSO vs Nilotinib; with two-tailed Student’s t test. d Representative immunofluorescence analysis of C2C12 myoblasts after 48 h of DMSO or Nilotinib treatment in differentiation medium shows nuclear (Hoechst in blue) localization of myogenin. Scale bar: 50 μm. e Quantification of the percentage (%) of myogenin-positive cells per field after 48 h of DMSO or Nilotinib treatment in differentiation medium. Values correspond to the mean ± SEM (n = 3). *P < 0.05; DMSO vs Nilotinib; with two-tailed Student’s t test. f Representative Western blot analysis that evaluates myogenin expression levels in DMSO or Nilotinib-treated myoblasts during a 4-day skeletal muscle differentiation time course. Tubulin was used as the loading control. GM growth medium. g Quantification of myogenin expression during a 6-day skeletal muscle differentiation time course. Values correspond to the mean ± SEM. n = 6; *P < 0.05, n.s non-significant; one-way ANOVA with Bonferroni post-test. h MyoD and Myogenin expression levels were analyzed by quantitative PCR in C2C12 myoblasts after 24 h (left graph) and 96 h (right graph) of treatment in differentiation medium. The values correspond to the mean ± SEM. n = 4; ***P < 0.001, n.s not significant
