Fig. 2.

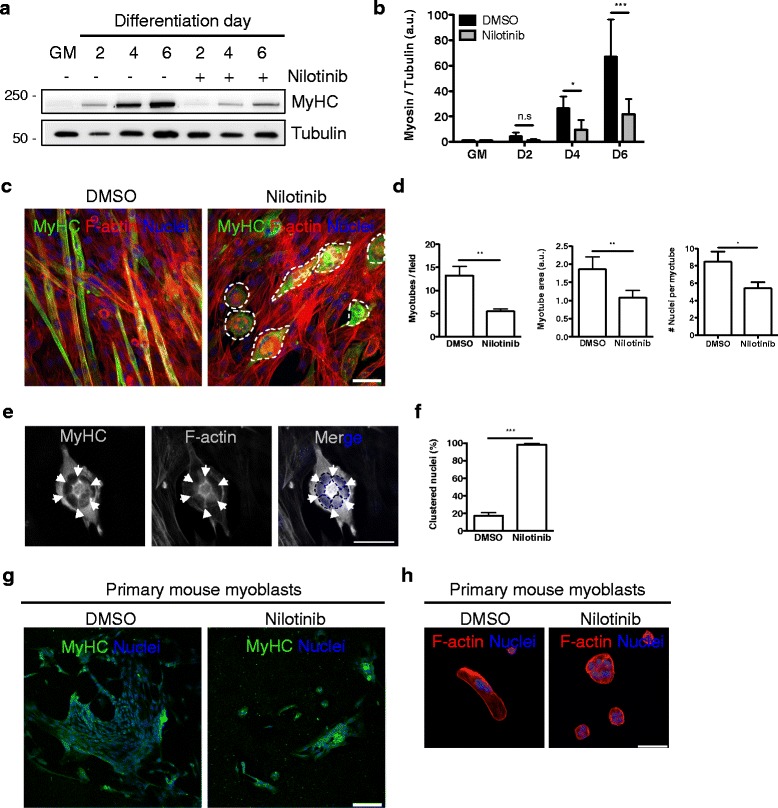
Nilotinib impairs MyHC expression and myotube formation. a Representative Western blot analysis, evaluating MyHC expression levels during a 6-day skeletal muscle differentiation time course. Tubulin was used as the loading control. b Quantification of six independent experiments, evaluating the expression of MyHC. The values correspond to the mean ± SEM. ***P < 0.001, *P < 0.05, n.s non-significant; n = 6; one-way ANOVA with Bonferroni post-test. c Immunofluorescence analyses showing the expression of MyHC (green) and F-actin (red) in differentiated myotubes at day 6. Dotted lines mark abnormal clustered myotubes due to Nilotinib treatment. Nuclei were stained with Hoechst (blue). Scale bar: 50 μm. d Quantification of three representative experiments, evaluating myotube number (left graph), area (center graph), and fusion index (# nuclei per myotube). The values correspond to the mean ± SEM. n = 3; **P < 0.005, *P < 0.05 DMSO vs Nilotinib; with two-tailed Student’s t test. e Representative immunofluorescence images showing ring-shaped clustered nuclei around a single myotube in Nilotinib-treated cells. MyHC (gray) and F-actin (gray) were stained, and Hoechst (blue) was used to identify nuclei. Arrows (white) mark intermediate zones in-between individual nuclei. Dotted lines (black) mark single nuclei. Scale bar: 50 μm. f Quantification of three representative experiments, evaluating the percentage (%) of clustered nuclei (ring-like structure) in DMSO and Nilotinib-treated cells. The values correspond to the mean ± SEM. n = 3; ***P < 0.001; DMSO vs Nilotinib; with two-tailed Student’s t test. g Primary mouse myoblast cells were treated with DMSO or 5 μM Nilotinib. Myogenic differentiation (at day 3 of DM) was assessed by MyHC immunofluorescence. h Ring-like structures were always observed when primary mouse myoblasts were differentiated in the presence of Nilotinib. F-actin (red) was used to label cell structure. Scale bars: 100 μm (g) and 50 μm (h)
