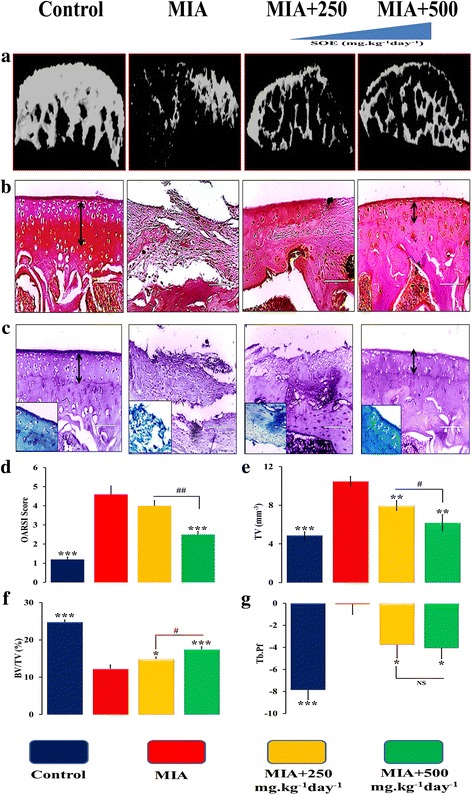
Fig. 4.

Histological and dynamic histological analysis of articular cartilage and subchondral bone in experimental groups. a 3D μ-CT images of articular cartilage. b safranin-O staining (c) toluidine blue staining of sagittal sections of tibia. Double headed arrow showing hyaline cartilage and calcified cartilage (d) OARSI score from five different sections n = 3 per group. Micro-CT analysis of sub-chondral bone (e) total tissue volume (TV), (f) bone volume/tissue volume (BV/TV and (g) trabecular porosity (Tb. Pf). All values are expressed as Mean ± S.E.M. (n = 6/group); *P < 0.05, **P < 0.01, ***P < 0.001 compared to the MIA group #P < 0.05, ##P < 0.01, compared to the 250 mg.kg− 1 day− 1 dose, NS= non significant
