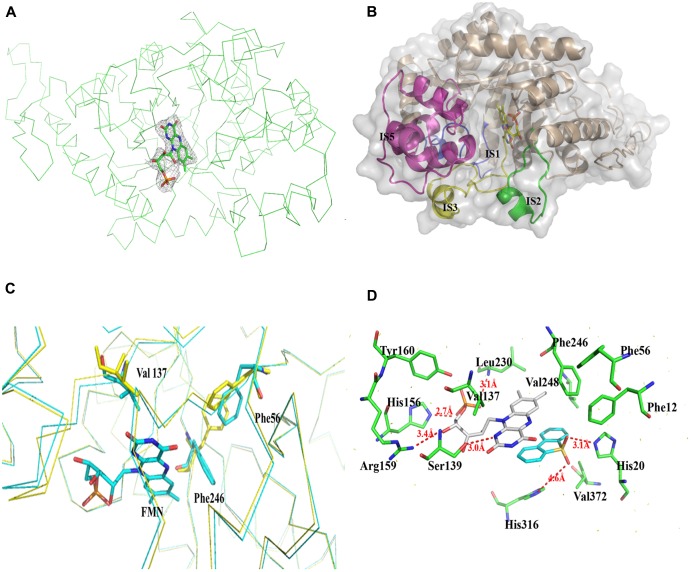
FIGURE 3.
Structure of BdsA-FMN complex. (A) The electron density map (contoured at 2.0σ) reveals the existence of FMN within BdsA active pocket. (B) The pocket constituting of IS1, IS2, IS3, and IS5 forms the active site of FMN and substrate binding. (C) Structure comparison of the apo and FMN bound BdsA. Yellow ribbon represents the apo-BdsA structure and cyan ribbon stands for the FMN bound structure. The FMN is depicted in color sticks. Distinct structural rearrangements occur at residues Phe56, Val137, and Phe246. (D) The docking result of the BdsA-FMN-DBT sulfone complex. Residues constituting the binding pocket are shown as green sticks. The cofactor FMN is shown as gray sticks. DBT sulfone is shown as cyan sticks. V137, S139, H156, R159, Y160, and L230 play significant roles in FMN binding. F12, F56, F246, V248, H316, and V372 play directional roles in substrate binding.

