
Fig. 2. Negative-stain electron microscopy analysis of NA structures reveals binding footprints for 1F2 and 4F11.
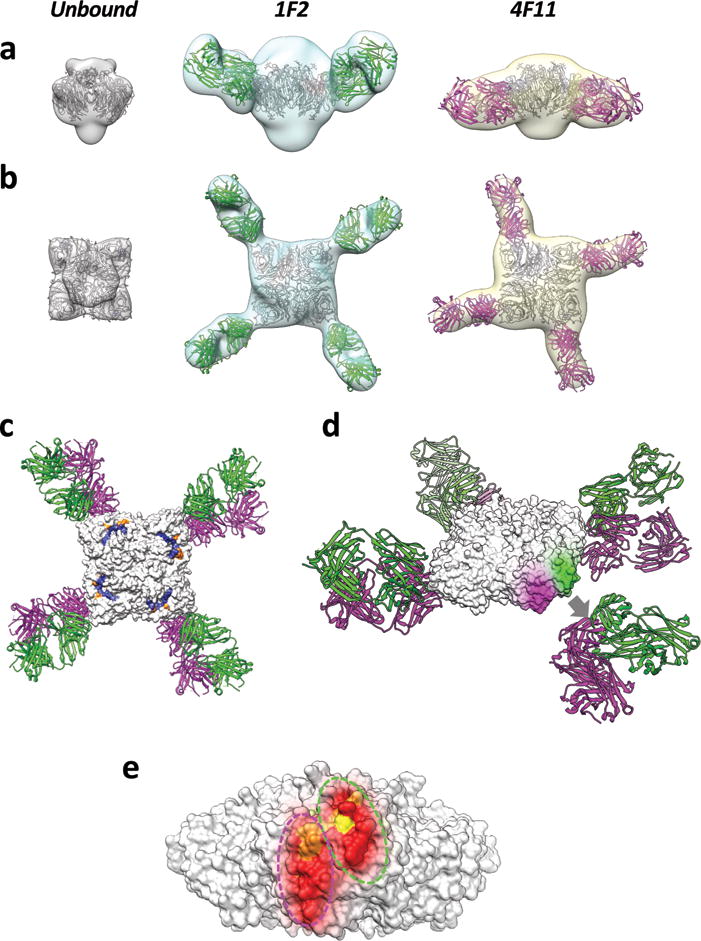
Side (a) and top (b) view isosurface representations of unbound, 1F2, and 4F11 bound NA density maps (grey, cyan, and yellow, respectively) fitted with coordinates for the NA tetramer and Fab (1F2 and 4F11 in green and magenta, respectively) x-ray coordinates. (a) and (b) are superimposed in top (c) and oblique (d) views of the IBV NA-Fab complexes. The top view also highlights the location of active site and framework residues in blue and orange, respectively. In the oblique view, the 1F2 and 4F11 binding footprints (green and magenta, respectively) are highlighted on the surface of the NA tetramer, with the corresponding Fab coordinates displaced away from the highlighted epitope region for purposes of visualization (grey arrow, d). Binding footprints of both Fabs are shown on a single NA tetramer to show their non-overlapping, but spatially adjacent locations (e). Residues within the binding footprint are colored as a heat map based on percent amino acid conservation (red: 98–100% conserved; orange: 75–98% conserved; yellow: 50–75% conserved).