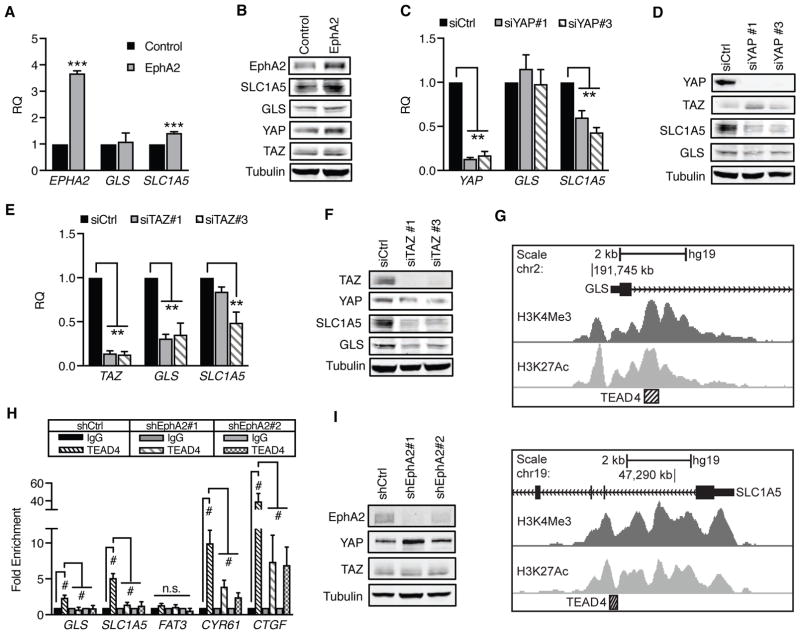
Figure 5. GLS and SLC1A5 gene expression are enhanced by EphA2-YAP/TAZ-TEAD4 signaling.
A,C,E) Relative mRNA expression in (A) MCF10A-HER2 (“Control”) or MCF10A-HER2-EphA2 cells (“EphA2”) or (C,E) MCF10A-HER2-EphA2 cells transfected with control (siCtrl) or individual siRNAs targeting (C) YAP or (E) TAZ. (A) EphA2, (C) YAP, and (E) TAZ were included to demonstrate expression of target genes. Error bars are SEM, calculated from three independent experiments. **p<0.01, ***p<0.005, Student’s t-test for (A) or one-way ANOVA for (C) and (E); Dunnett’s post-hoc. B,D,F) Western blot of GLS and SLC1A5 in cells used in qRT-PCR. G) TEAD4 ChIP-seq at GLS (top) and SLC1A5 (bottom), downloaded from UCSC ENCODE Genome Browser. TEAD4-associated regions (hatched box) correlate with H3K4Me3 and H3K27Ac near exon 1 (black). H) Chromatin immunoprecipitation of MCF10A-HER2 cells transduced with shCtrl, shEphA2#1, or shEphA2#2. Relative immunoprecipitated genomic DNA was determined by qRT-PCR and normalized to IgG controls from four independent experiments. Error bars represent SEM. #p<0.005, two-way ANOVA, Tukey’s post hoc; non-significant (n.s.) comparisons are indicated. A) Western blot of EphA2 knockdown in cells used in (H).

