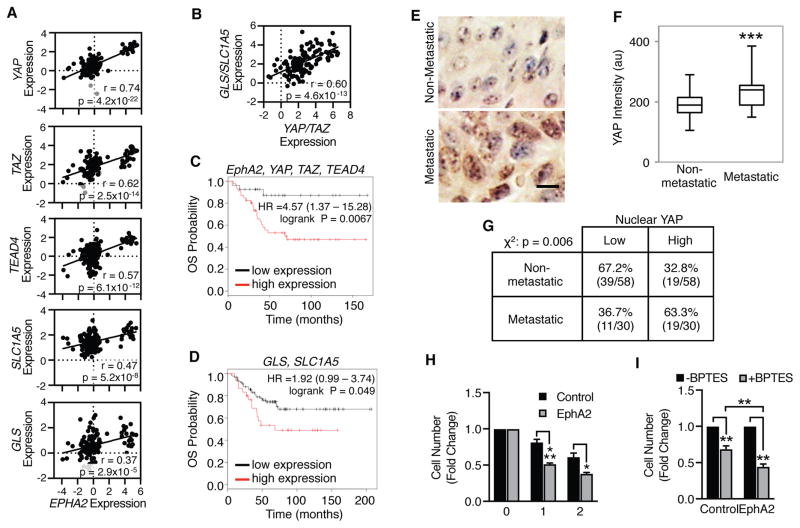
Figure 6. EphA2 and YAP/TAZ expression correlates with increased glutaminolysis gene expression in human breast cancer patient data.
A,B) Log2(mRNA) expression from the Minn Breast 2 database (n=121). Pearson correlations (r) and T-distribution (p) coefficients are shown. C,D) Kaplan-Meier analysis of overall survival (OS) in HER2+ breast cancer patients (C: n=73; D: n=117) exhibiting low (black) or high (red) (C) EphA2, YAP, TAZ, and TEAD4 or (D) GLS and SLC1A5 expression. E–G) Immunohistochemistry of YAP in HER2-positive samples from a human breast carcinoma TMA. Representative images are shown in (E). Scale bar is 10 μm. F) Plot of YAP staining intensity per cell in HER2-positive TMA patient samples. ***p<0.005, Student’s t test. G) Samples from (F) further stratified according to levels of YAP nuclear localization, using the median percentage as the cutoff. Chi-square analysis (χ2) was calculated. H, I) BPTES sensitivity in (H) MMTV-Neu or (I) MCF10A-HER2 cells retrovirally transduced with pBABE (“Control”) or pBABE-EphA2 (“EphA2”) and treated with vehicle or BPTES (10 μM) for times indicated. Cell counts were calculated as fold change from vehicle controls from three independent experiments. *p<0.05, **p<0.01, ***p<0.005, (H) two-factor ANOVA or (I) one-way ANOVA, post-hoc Tukey’s.

