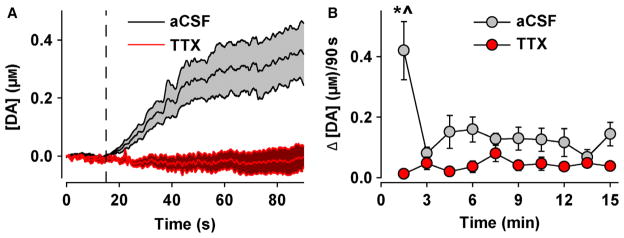
Fig. 4.
TTX abolishes AMPH-induced elevations in the NAc. (A) Dopamine concentration ([DA]) plotted with time during the first 90 s epoch. Either aCSF or TTX was infused into the VTA at the vertical dashed line. (B) Change in the dopamine concentration (Δ[DA]) within each 90 s epoch and plotted with time. Data are expressed as mean ± SEM. *P < 0.001 vs. TTX (between-group comparisons); ^P < 0.001 vs. aCSF (within-group comparisons).

