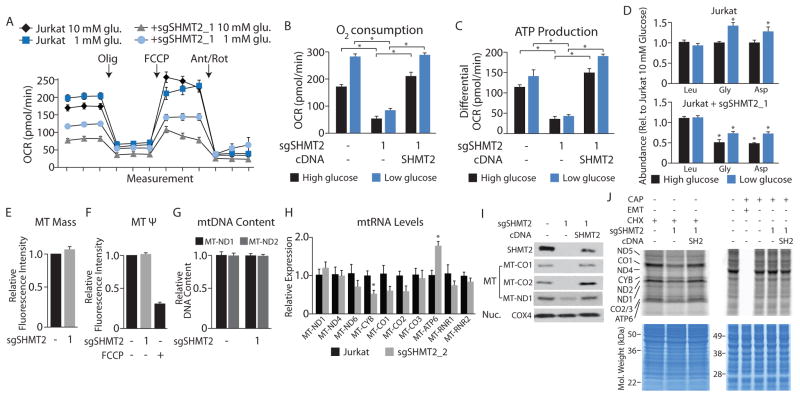
Figure 2. SHMT2 is required for proper mitochondrial respiration and translation of mitochondrially encoded proteins.
A, Oxygen consumption rate (OCR) of Jurkat cells cultured at the indicated glucose concentrations from a representative experiment. Jurkat cells or a clone expressing small guide RNAs targeting SHMT2 (sgSHMT2) were seeded at 200,000 cells per well immediately prior to the assay. The complex V inhibitor oligomycin (Olig), the uncoupler carbonyl cyanide 4-(trifluoromethoxy)phenylhydrazone (FCCP), and the complex I and III inhibitors Antimycin (Ant) and Rotenone (Rot) were added sequentially to a final concentration of 1 μM at the indicated time points. B, Basal OCR from the lines described in A and cells re-expressing an SHMT2 cDNA. C, Proportion of OCR contributing to ATP production (measured as the decrease in OCR upon oligomycin treatment) from the lines described in A–B. D, Intracellular levels of the indicated amino acids in the indicated cell lines cultured in media containing 10 mM (high glucose) or 1.5 mM glucose (low glucose), as measured by LC/MS. E, Relative mitochondrial mass as assessed by flow cytometry based measurement of fluorescence from the indicated Jurkat cell lines stained with mitotracker green FM (75 nM). F, Relative mitochondrial membrane potential (Ψ) as assessed by flow cytometry based measurement of fluorescence from the indicated Jurkat cell lines stained with tetramethylrhodamine, methyl ester, perchlorate (200 nM). Indicated cells were treated with FCCP (20 μM). G, Relative mitochondrial DNA content in Jurkat cell lines as assessed by qPCR based measurement of the indicated mtDNA genes, normalized to an Alu repeat sequence. H, Relative mitochondrial expression in Jurkat cell lines as assessed by qPCR based measurement of the indicated mitochondrial genes. I, Immunoblot from cell lysates of the indicated lines for proteins encoded by the indicated genes. MT-CO1, MT-CO2, and MT-ND1 are encoded by the mitochondrial genome and translated in the mitochondria (MT) whereas COX4 is encoded by the nuclear genome and translated in the cytoplasm (Nuc.). J, 35S-cysteine and 35S-methionine pulsed labeling of mitochondrial proteins (top left, 60 μg) or cytoplasmic proteins of a similar size (top right, 20 μg) from the indicated cell lines. Compounds used to inhibit translation are chloramphenicol (CAP, 100 μg/mL), emetine (EM, 100 μg/mL), or cycloheximide (CHX, 100 μg/mL). Gels stained for total protein with coomassie blue as a loading control, molecular weight markers indicated (bottom). The identity of individual mitochondrial proteins is indicated on the right and is inferred by comparing the banding pattern to published results (Tucker et al., 2011) as well as subsequent immunoblotting for CO1 and CO2. * p < 0.05. Error bars are s.e.m. n=4–5 for A, n=3 for B–H.

