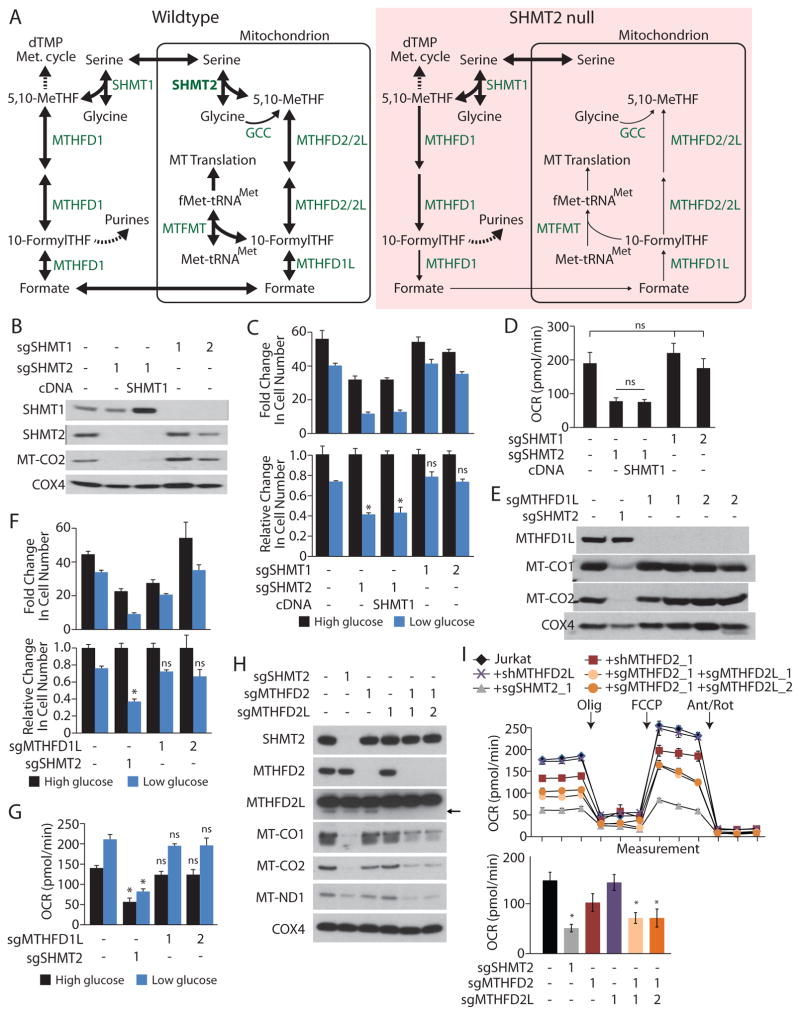
Figure 3. Depletion of mitochondrial one-carbon units upon SHMT2 loss prevents proper mitochondrial translation.
A, Overview schematic of one-carbon metabolism indicating cytoplasmic and mitochondrial compartmentalization in wildtype cells (left), and proposed alterations upon SHMT2 deletion (right). While reactions are reversible, arrow direction and thickness indicate hypothetical relative flux upon SHMT2 deletion. Enzymes and the glycine cleavage complex (GCC) are indicated in green. Key metabolites are indicated in black. THF = tetrahydrofolate. B, E, and H, Immunoblot from cell lysates of Jurkat cell lines for proteins encoded by the indicated genes. Jurkat cell clones express sgRNAs targeting SHMT1, SHMT2, MTHFD1L, MTHFD2, or MTHFD2L or a cDNA expressing SHMT1, as indicated. For the MTHFD2L immunoblot in panel H, the arrow indicates the band corresponding to MTHFD2L protein, whereas the prominent larger band is non-specific. C and F, Above, proliferation of Jurkat cells or clones expressing the indicated sgRNAs and cDNAs. Below, data from above, normalized to the 10 mM glucose condition for each cell line. Cells were grown for 5 days in media initially containing 10 mM (high glucose) or 1.5 mM glucose (low glucose). D, Basal oxygen consumption rate (OCR) of the cell lines from A, cultured in 10 mM glucose. G, Basal oxygen consumption rate (OCR) of the cell lines from F, cultured in 10 mM (high glucose) or 1.5 mM glucose (low glucose). I, Basal oxygen consumption rate (OCR) of the cell lines from H, cultured in 10 mM glucose. * p < 0.05, ns = not significant. Unless otherwise indicated, these statistical measurements are in reference to Jurkat cells cultured at the same glucose concentration. Error bars are s.e.m. n=3 for C, D, G, I; n=6 for F.

