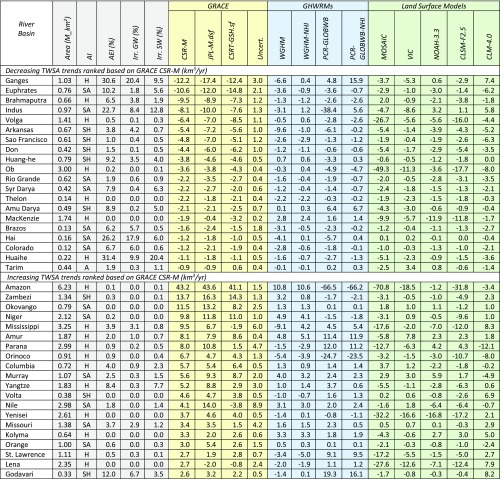
Table 2.
Approximately decadal (2002–2014) trends in TWSA in cubic kilometers per year in selected basins (river basin names) showing decreasing and increasing trends ranked according to trends in GRACE CSR-M
 |
AEI %, area equipped for irrigation in percent of basin based on GW (Irr. GW %) and SW (SW %); AI, aridity index.
