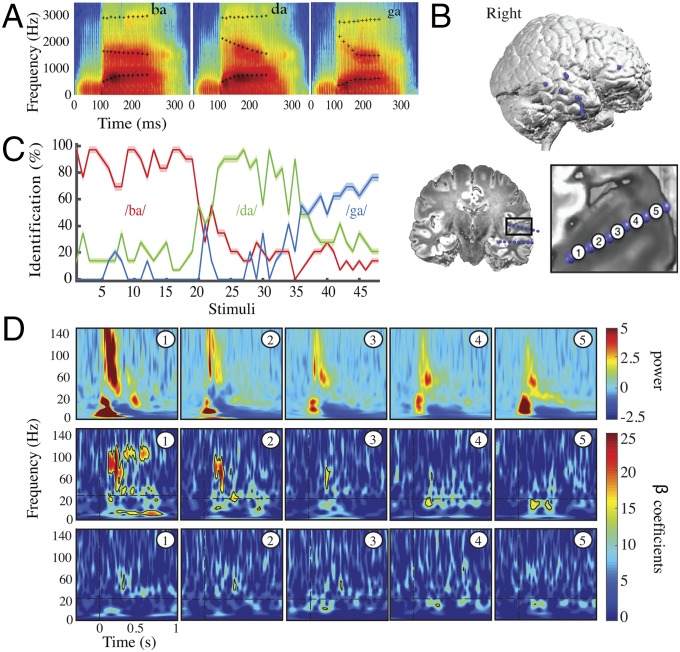
Fig. 3.
i-EEG results in patient 1. (A) Spectrograms of /ba/, /da/, and /ga/ prototype stimuli synthesized with linear parametric F2 parameters. (B) Locations of i-EEG contacts in patient 1. The auditory shaft labeled shaft 1 penetrated the right pSTG and Heschl’s gyrus. The patient had five other shafts distributed in the right temporal lobe. Bipolar montages from adjacent contacts are shown in the Bottom Right figure. (C) Percentage of syllable identification for each category for the three patients. The shaded zone indicates the SEM. The first 20 stimuli are categorized as /ba/, the next 13 stimuli are categorized as /da/, and the last 11 stimuli are categorized as /ga/. (D, Top) Evoked activity, averaged across stimuli, on each bipolar montage from the deepest contact (number 1) to the most external contact (number 5) in the auditory shaft (shaft 1). (Middle) Time–frequency representations of beta coefficients from the regression of F2 values against evoked activity on each contact of the auditory shaft. Significant F2 tracking was found in all contacts of the auditory shaft, with stronger effects in the two deepest contacts. (Bottom) Time–frequency representations of beta coefficients from regression of d′ values against evoked activity on each contact of the auditory shaft. Decisional effects were significant on the third auditory contact about 200 ms poststimulus onset in the beta band. The vertical dashed lines indicate stimulus onset. The horizontal dashed lines indicate a change in the scaling of the oscillatory power for each time point and each frequency, with a 0.5-Hz resolution below 20 Hz and a 1-Hz resolution above 20 Hz. Black contours indicate significant t tests at q < 0.05 (FDR correction).

