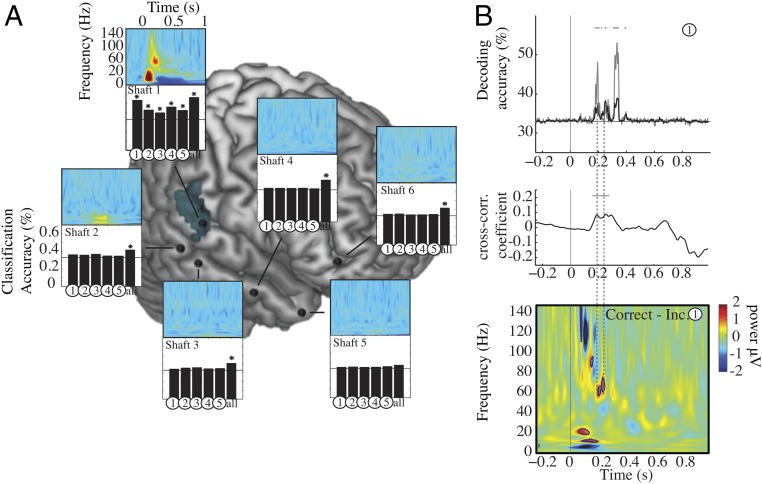
Fig. 4.
Decoding in patient 1. (A, right hemisphere) Colored panels show time–frequency representation of evoked activity on each shaft. A strong evoked response to syllables is present only in the auditory shaft. Bar graphs show neural decoding through univariate and multivariate classifiers. Histogram bars numbered from 1–5 show the univariate classifier results based on the activity from each contact of each shaft. The bar at the far right (“all”) shows the multivariate classifier results based on multidimensional information from all contacts of each shaft. Stars above the black bars signal significant classification accuracy for specific contacts within each electrode shaft (q < 0.05, FDR-corrected). Univariate classification was possible from all auditory contacts of shaft 1 overlapping fMRI F2 parameters activation (blue-shaded area) but worked best in the deepest one. Univariate classification failed everywhere except for these auditory contacts, whereas syllable decoding worked above chance using the multivariate approach in shafts 1, 2, 3, 4, and 6. (B, Bottom) Time–frequency differences between correct-minus-incorrect classification computed on contact 1 of shaft 1. Black borders indicate significant differences in neural activity between correct and incorrect classification scores, in comparison with a zero-mean normal distribution at q < 0.05, FDR-corrected. (Top to Bottom) Temporal relationship between the time course of machine decoding from the deepest auditory contact (Top, black line), mean univariate classification from all auditory contacts (Top, gray line), and the time–frequency cues used by the subject to make a correct perceptual decision (difference in the time–frequency response between correctly and incorrectly recognized syllables, Bottom). The thick gray lines show significant results for each time point (significant decoding accuracy, q < 0.05, FDR-corrected). (Middle) Cross-correlation coefficients between univariate decoding accuracy and significant correct-minus-incorrect time–frequency clusters. Significant effects were found in the 60- to 80-Hz high-gamma band. The horizontal black line indicates significant cross-correlation coefficients at P < 0.05 (Bonferroni-corrected).

