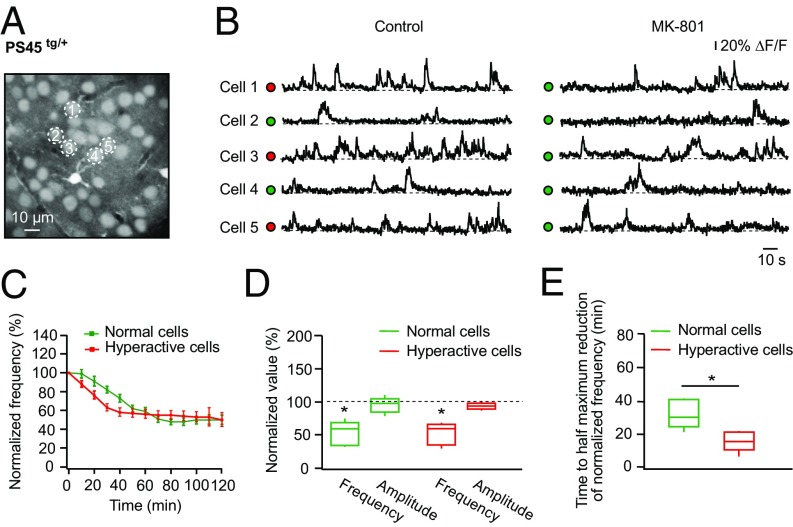
Fig. 6.
Activity-dependent blockade of postsynaptic NMDA receptors reveals higher release probability of synapses driving spontaneous activity in hyperactive cells. (A) Maximum intensity projection image of layer 2/3 in the frontal/motor cortex of a PS45tg/+ mouse (177- to 183-μm depth). (B) Spontaneous Ca2+ transients recorded from neurons labeled with respective numbers in A under control conditions (Left) and after 50 min of topical application of 200 μM MK-801 (Right). ΔF/F, relative change in fluorescence. (C) Normalized frequency of spontaneous Ca2+ transients plotted against the duration of the topical MK-801 application measured in normal (green; n = 34 cells in five mice) and hyperactive (red; n = 20 cells in five mice) cells. Data shown in this graph represent mean values ± SEM. (D) Box-and-whisker plot illustrating the maximal effect of MK-801 on the frequency and amplitude of spontaneous Ca2+ transients in normal (green) and hyperactive (red) cells. All values measured under MK-801 are normalized to respective control values. Note a significant reduction of frequency in both normal and hyperactive cells [two-way repeated measures ANOVA: F2,16 = 48.37, P < 0.01 for both comparisons], whereas amplitudes are not affected [P = 0.99 (normal cells) and P = 0.86 (hyperactive cells)]. (E) Box-and-whisker plot illustrating the time needed for normal (green) and hyperactive (red) cells to reach the half-maximal reduction of the frequency of spontaneous Ca2+ transients. This time period is significantly shorter for hyperactive cells compared with normal cells (Student’s t test: t8 = 3.48, P < 0.01). *P < 0.05 in D and E.

