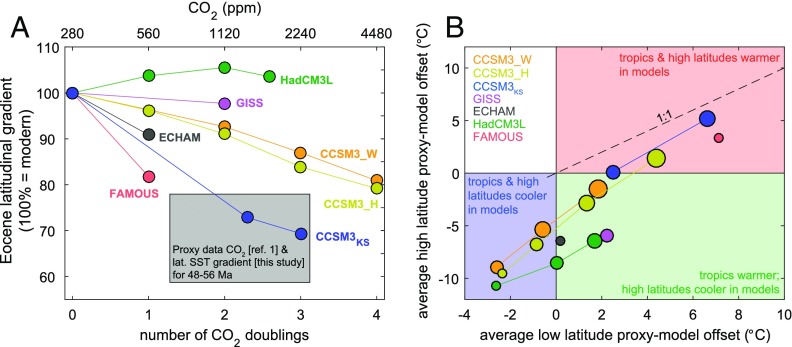
Fig. 5.
Early Eocene (48–56 Ma) model-data comparison. (A) Zonally averaged latitudinal gradients based on proxy CO2 and SST data (gray box) and climate models over a range of CO2 (circles) (12, 46–48, 60). Proxy CO2 range is from ref. 1; the gradient uncertainty is the combined 2 SE of the tropical and high-latitude proxy data (see text). Proxy-derived gradient is shown relative to present day; Eocene climate model simulations are shown relative to their preindustrial counterpart. Most model simulations do not capture the reduced latitudinal gradient within the range of proxy CO2 (<2,250 ppm). (B) Site-specific model-data comparison for both the tropics and high latitudes. Model SST competency assessed by comparing the mean difference between the model and proxy data for low and high latitudes. Quadrants reflect different overall patterns of model-data offset. Hypothetical simulations falling on the 1:1 line would reconstruct the same latitudinal gradient as the data but not the same absolute SST, except at the origin. All models fall below this line, indicating that Eocene polar amplification is underestimated.

