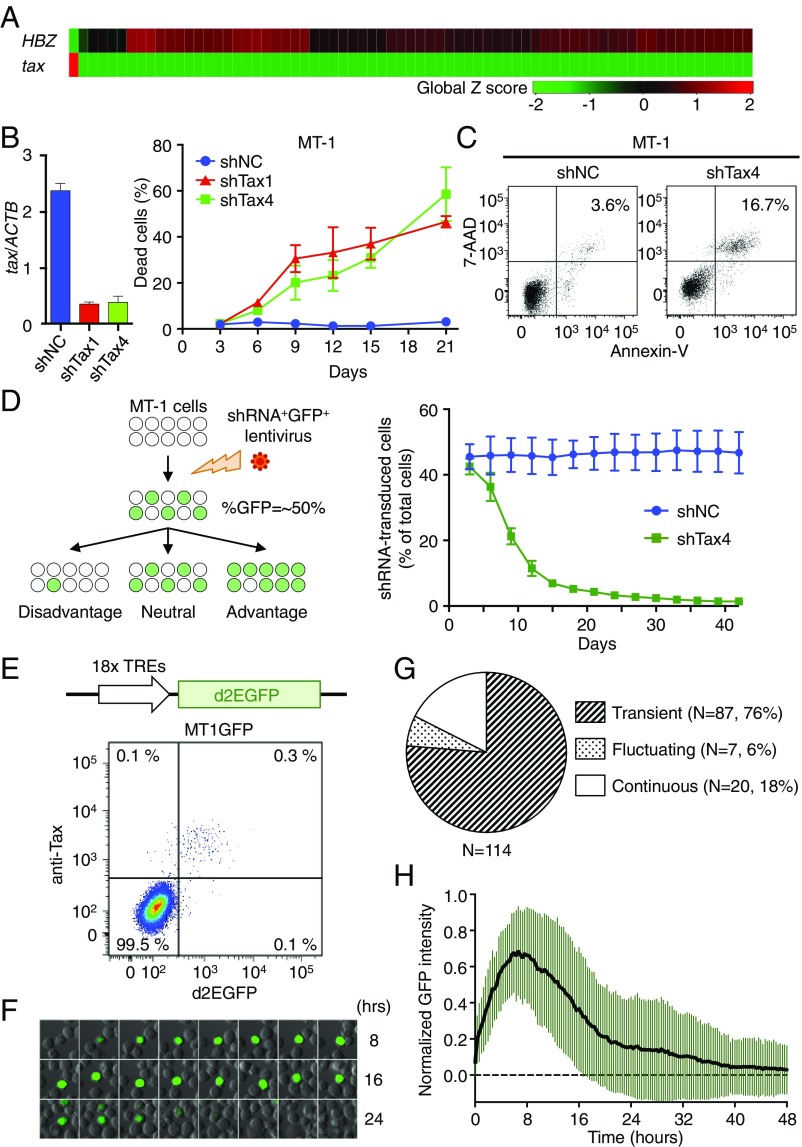
Fig. 1.
Significance and dynamics of Tax expression at a single-cell level in MT-1 cells. (A) Single-cell qPCR for tax and HBZ expression in MT-1 cells (n = 71). (B, Left) Efficiency of Tax-KD by shRNA. (B, Right) The percentage of cells that are dead after Tax-KD. MT-1 cells were infected with a bicistronic lentivirus vector expressing GFP and shRNA (shTax1, shTax4, or shNC). Cells were stained with LIVE/DEAD reagent, and the ratio of dead cells to shRNA-transduced (GFP+) cells was measured by flow cytometry. (C) AnnexinV/7-AAD double staining in shRNA-transduced MT-1 cells at day 15 posttransduction. (D, Left) Schematic depicting the concept behind the GFP competition assay. The ratio of GFP+ cells changes over time depending on the effect of shRNA on transduced cells. (D, Right) Serial measurements of the percentage of GFP+ cells among the whole MT-1 cell population after shNC or shTax4 transduction. For B and D, error bars show SDs for three experiments. (E, Upper) Scheme of Tax reporter cassette that expresses d2EGFP. MT1GFP is a stable subline of MT-1 transduced with this cassette. (E, Lower) Intracellular Tax staining of MT1GFP. (F) Live cell imaging of Tax expression in MT1GFP cells. This montage of time-lapse images shows changes in d2EGFP expression. (G) Expression pattern of Tax in MT1GFP. Cells were categorized based on their pattern of d2EGFP expression during the observation period. Continuous, cell continuously expressed d2EGFP until the end of observation period; fluctuating, cell has multiple episodes; transient, cell has a single spontaneous episode. (H) Single-cell dynamics of d2EGFP expression for 87 cells with transient expression. Mean ± SD is shown.

