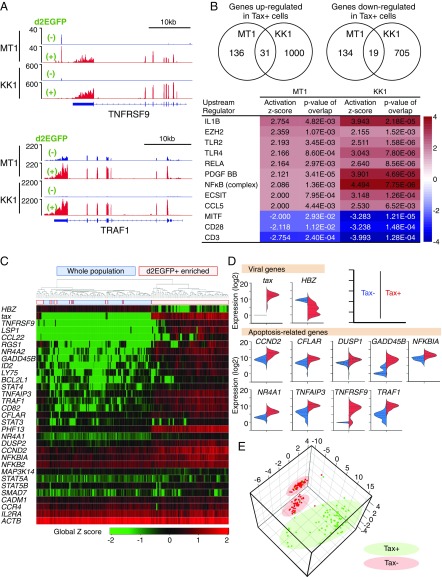
Fig. 2.
Differences in gene expression between Tax-expressing and -nonexpressing MT1GFP cells. (A) RNA-Seq analysis comparing Tax+ and Tax− MT1GFP and KK1GFP cells. Read coverage plots for two Tax-associated genes: TNFRSF9 (Upper) and TRAF1 (Lower). (B) Ingenuity pathway analysis for dysregulated genes. Inclusion criteria are fragments per kilobase of transcript per million mapped reads (FPKM) ≥ 1 and greater than or equal to twofold expression change. (Upper) The number of dysregulated genes common to both MT1GFP and KK1GFP. (Lower) Top-scoring activated or inactivated upstream regulators. (C) Heat map of single-cell gene expression for viral and cellular genes in single MT1GFP cells. Two experiments were performed; either d2EGFP+-enriched or -unenriched (whole) populations were subjected to single-cell analysis. Ninety-four cells from each experiment were analyzed. (D) Violin plots comparing expression of viral- and apoptosis-related genes in the Tax+ vs. Tax− populations. Based on the apoptotic process gene list (GO:0006915; Gene Ontology database), nine apoptosis-related genes with expression levels that were significantly correlated with that of tax (r value > 0.5 by Pearson’s correlation test) were identified. (E) 3D PCA plot showing single-cell data clustering based on expression of apoptosis-related genes from D.

