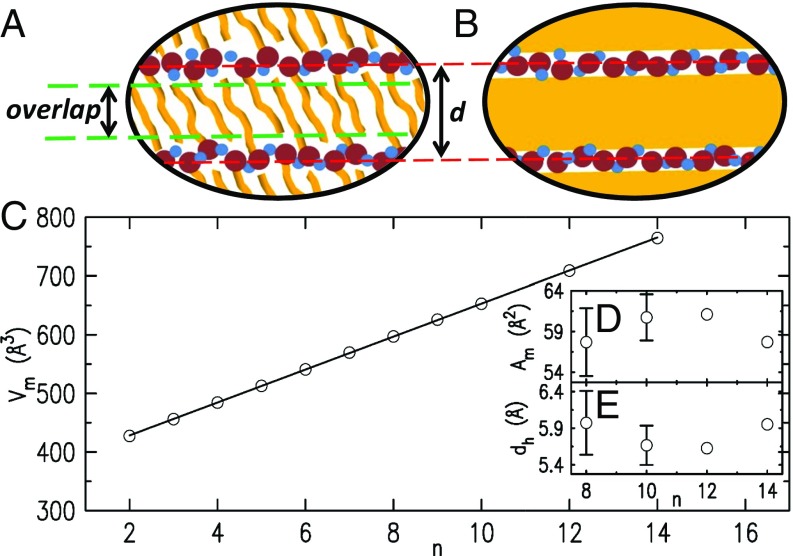
Fig. 5.
(A and B) Cartoons of the alkyl slab structure for (A) the IC model, comprising flexible ICs, and (B) the LL model, comprising a LL alkyl layer. Brown and blue circles, yellow flexible rods, and yellow areas represent, respectively, cation headgroups, anions, alkyl chains, and LL alkyl domains. (C–E) The density-based analysis. (C) The RTILs’ molecular volumes (symbols) as calculated from the RTILs’ mass densities , and their linear fit (line). Note the excellent agreement for all . (D) Calculated molecular areas . (E) Calculated headgroup heights . For discussion, see text.

