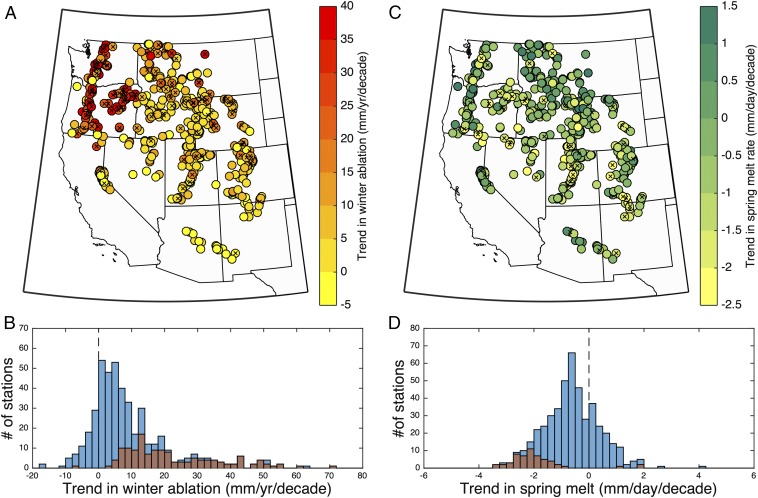
Fig. 1.
Trends in winter and spring ablation over the last 3 decades. Trends in (A and B) winter ablation and (C and D) spring melt rate (C and D) from 1985 through 2015 at 462 sites. Symbol colors (A and C) represent magnitude of change, and crosses denote sites with significant trends (P < 0.05). Histograms (B and D) show the number of sites with trends at varying magnitudes (blue bars); red bars are significant trends (P < 0.05).

