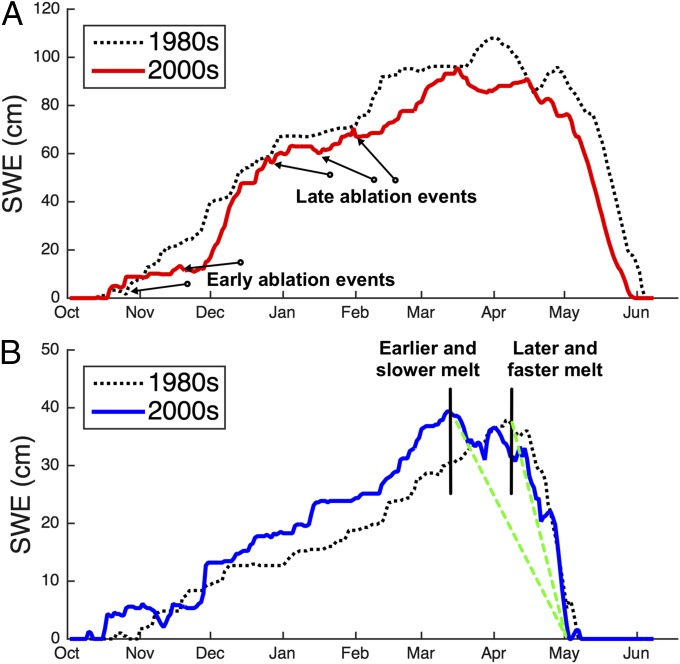
Fig. 2.
(A) Example SWE time series from a site (388, Cascade Summit, OR) representing the Pacific Northwest, with similar winter precipitation between 1988 and 2001. The absolute humidity was 3.0 in 1988 versus 3.7 g/m3 in 2001, and the winter ablation had a corresponding increase from 40 to 160 mm. (B) The second example site (618, McClure Pass, CO) represents the Southwest, where melt began earlier and was warmer in 2006 than 1986 (mean temperature of −2.0 and −3.2 °C, respectively). During the warmer and earlier snowmelt in 2006, the melt rate was slower (green dotted line) than the cooler 1986 (average melt rate of 0.8 and 1.4 cm/d, respectively).

