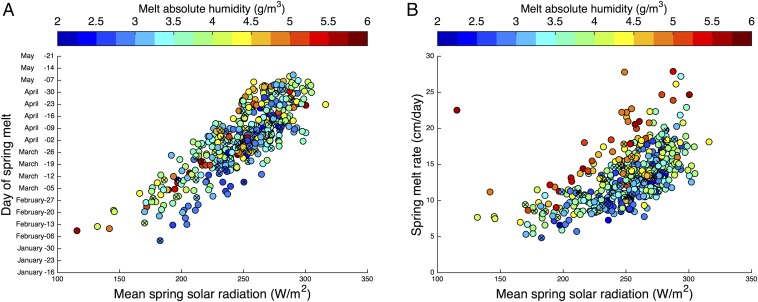
Fig. 3.
(A) Day of spring melt initiation as a function of spring solar radiation and (B) spring melt rate as a function of solar radiation for the 462 sites. The symbol colors represent the mean melt season absolute humidity. The crosses denote significant changes (P < 0.05) in either the day of melt or spring melt rate. Spring melt rate slowed with lower solar radiation inputs that were caused by an earlier initiation of melt when sun angles and incoming radiation were lower.

