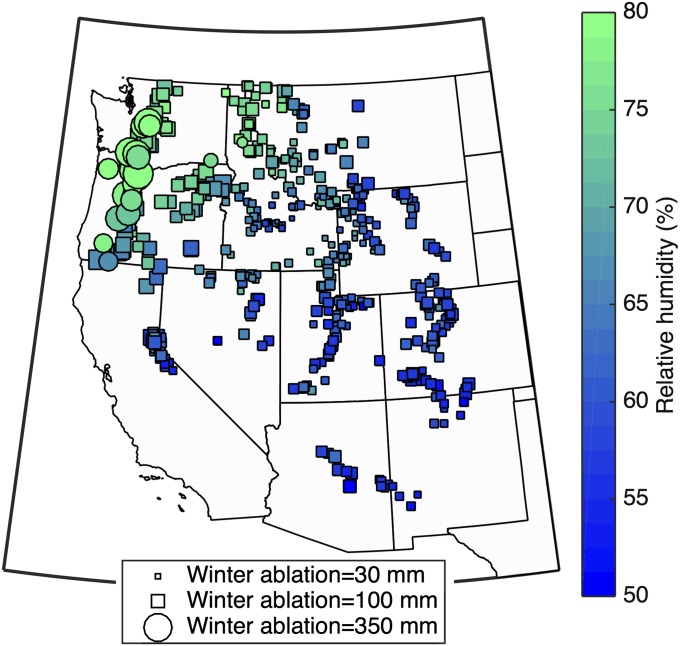
Fig. 6.
Mean winter ablation over the last 30 y (size of symbol) for sites with mean winter absolute humidity above 3.5 g/m3 (circles) and below (squares). The symbol color shows the mean winter relative humidity. Lower relative humidity drives lower winter ablation via sublimation, whereas at-risk areas with absolute humidity >3.5 g/m3 had much higher ablation losses from episodic melt events. However, the winter ablation as a percent of the snowpack could be high in places in the SW where snowpacks were smaller (SI Appendix, Fig. S6).

