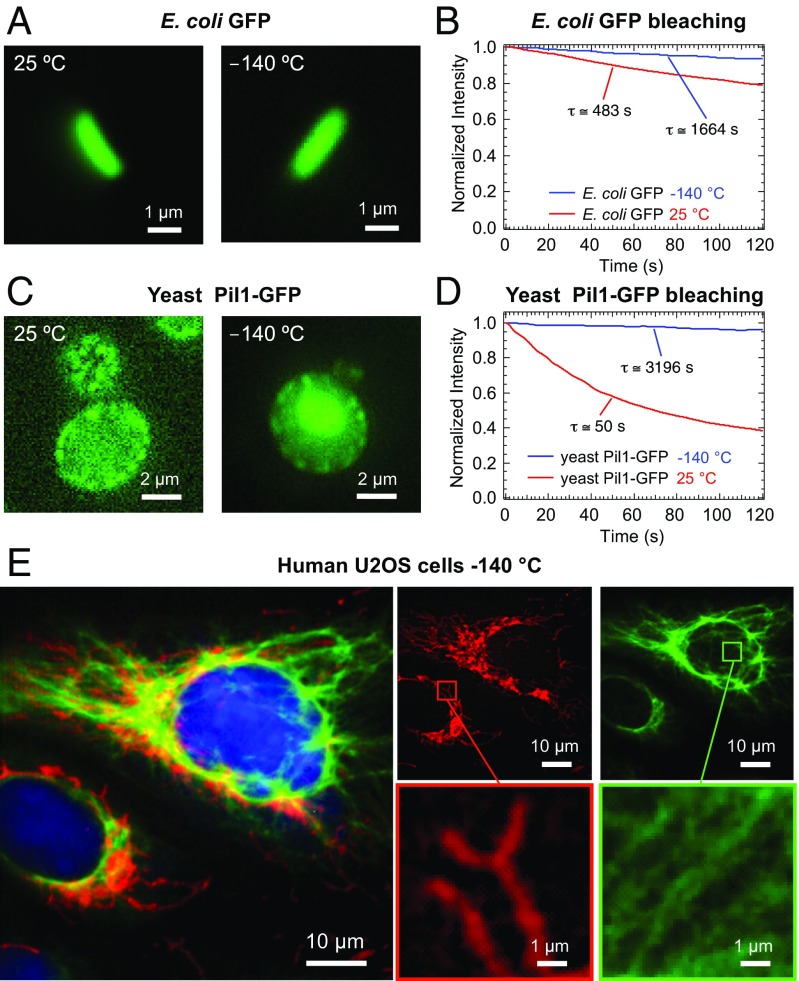
Fig. 3.
Imaging of cryofixed biological specimens with the prototyped cryoimmersion objective. (A) Room-temperature (Left) and cryogenic (Right) widefield fluorescence images of Escherichia coli expressing GFP. (B) Photobleaching curves for GFP expressed in E. coli. The red curve shows decay at room temperature, and blue curve shows decay at C. In cryoconditions, the GFP bleaching is suppressed 3.5 times. (C) Room-temperature (Left) and cryogenic (Right) widefield fluorescence images of yeast cells expressing GFP-tagged Pil1. (D) Photobleaching curves for GFP expressed in yeast cells. The red curve shows decay at room temperature, and the blue curve shows decay at C. In cryoconditions, the GFP bleaching is suppressed 64 times. (E) Three-color widefield cryofluorescence image of plunge frozen U2OS cells labeled with Alexa Fluor 488 (vimentin cytoskeleton), Alexa Fluor 594 (Tom20 mitochondrial protein), and DAPI (cell nuclei).

