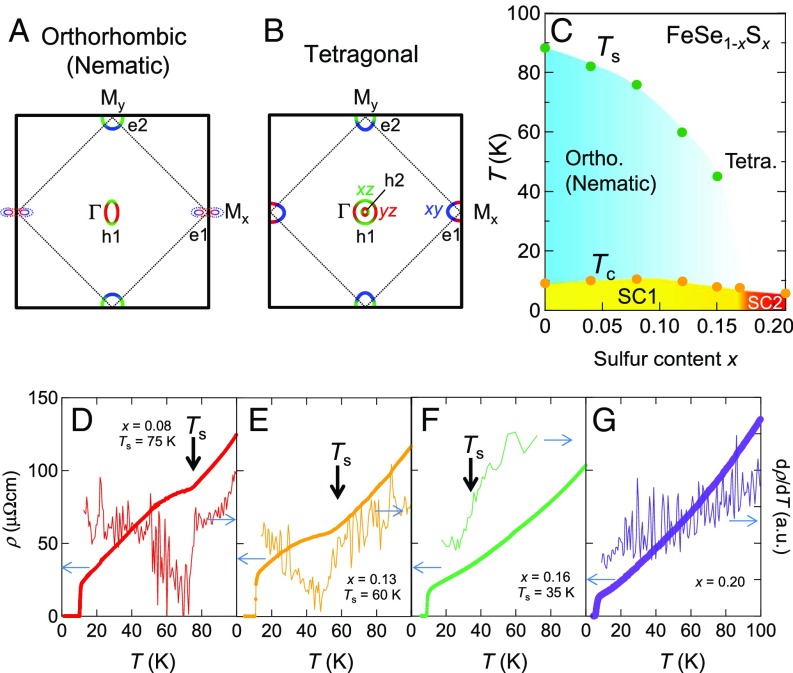
Fig. 1.
(A and B) Schematic illustrations of the Fermi surface in the nematic and the tetragonal phases (23). Green, red, and blue areas represent the Fermi surface regimes dominated by , , and orbital characters, respectively. (C) – phase diagram of FeSe1 − xSx. (D–G) Temperature dependence of resistivity (thick lines) and its temperature derivative (thin lines) for single crystals of FeSe1 − xSx for (D) , (E) x = 0.13, (F) x = 0.16, and (G) x = 0.20. Thick arrows indicate the nematic transition temperatures.

