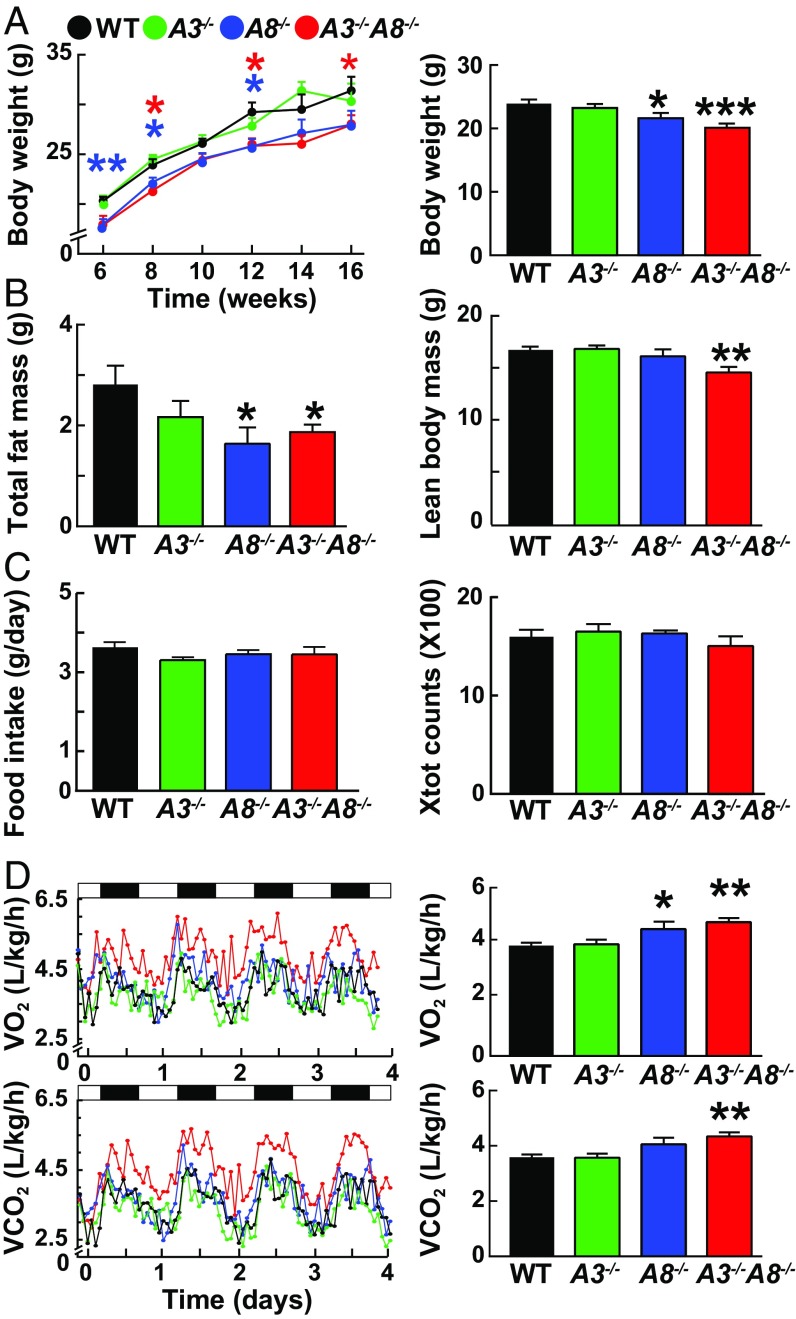
Fig. 1.
Metabolic characterization of A3−/−, A8−/−, A3−/−A8−/−, and WT male mice. (A) Body weights of A3−/−, A8−/−, A3−/−A8−/−, and WT mice (n = 10–12 per group) were measured every other week starting at 6 wk of age (Right). Body weight (A) and composition (B) were measured in mice aged 8–10 wk (n = 6 per group). The experiment was repeated once, and the results were similar. (C) Food intake (Left) and total activity (Right) were assessed in mice housed individually in metabolic cages for 7 d. (D) Both O2 consumption and CO2 output were measured for 1 min at 30-min intervals for four consecutive days while the mice were housed in metabolic cages (n = 9; age 8–12 wk). Values are means ± SEM. Group means for VO2 consumption and VCO2 output were compared by ANCOVA with body weight as a covariate; similar results were obtained with an unpaired t test. Group means for other parameters were compared by using unpaired t tests. *P < 0.05; **P < 0.01; ***P < 0.001.

