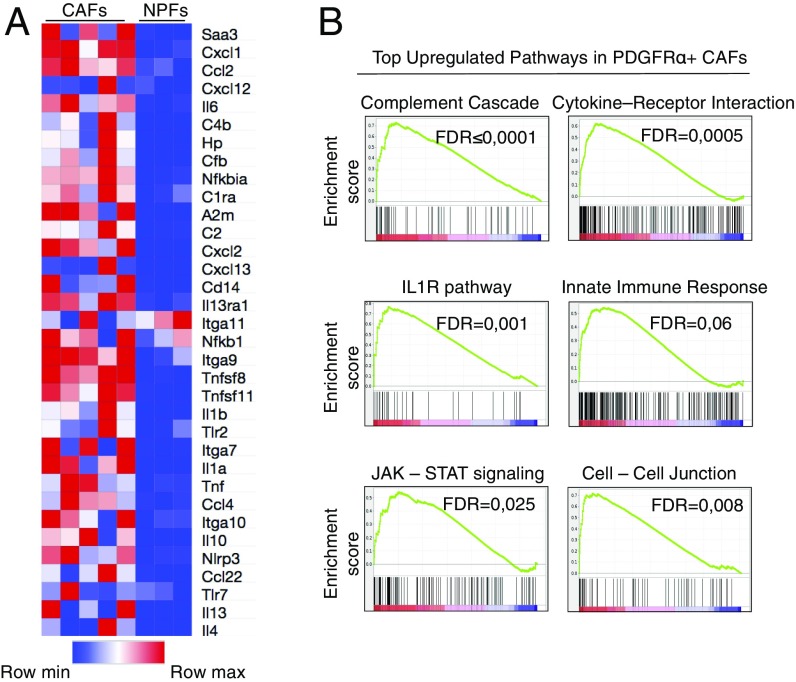
Fig. 2.
Transcriptional profiling of CAFs. (A) Heat map representing color-coded expression levels of differentially expressed inflammatory genes in CAFs (n = 5) vs. NPFs (n = 3). The heat map was generated from differential expression analysis, in which data were sorted by FPKM (fragments per kilobase of transcript per million mapped reads) expression value and log2 fold change with a q-value ≤0.05. The specific inflammatory gene set was selected from publicly available databases. (B) GSEA of CAFs significantly up-regulated in inflammatory and cell-adhesion pathways.

