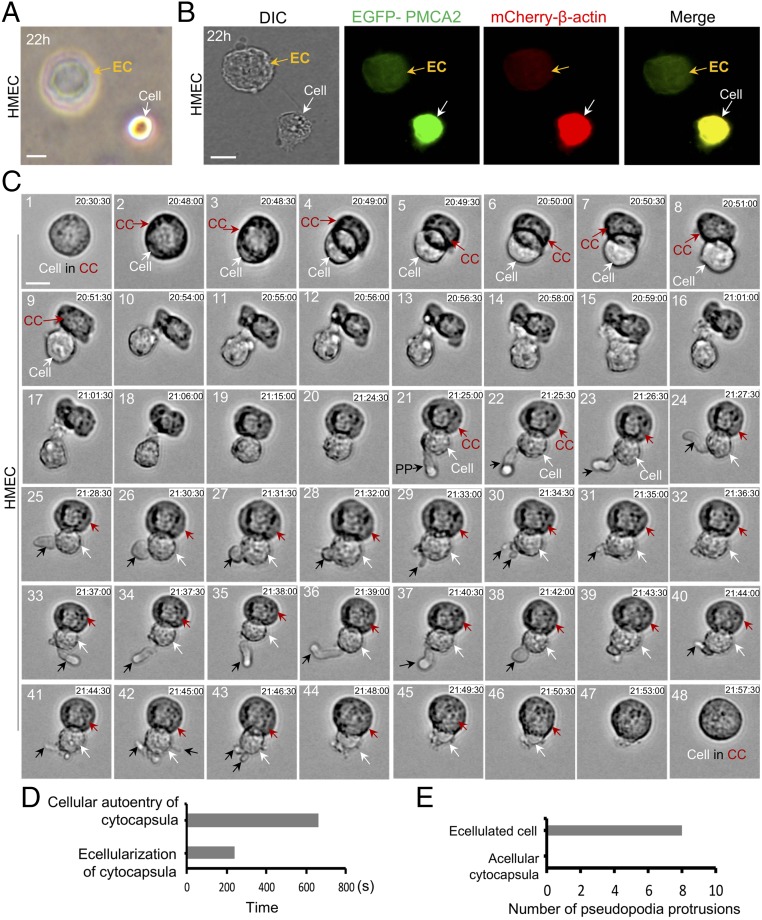
Fig. 3.
Ecellularization and autoentry of cytocapsulae. (A) Ecellularization of cytocapsulae with complete separation. An ecellulated cytocapsula (EC) is shown. (B) DIC and fluorescence microscope examination of cytocapsula ecellularization with complete separation. (C) Real-time analysis of ecellularization with incomplete separation and autoentry of a cytocapsula with a time-lapse DIC microscope. The DIC images are taken from Movie S1. The cell (white arrows), cytocapsula (CC; red arrows), and pseudopodia protrusions (PP; black arrows) are shown. (D) Quantitation of the time of ecellularization and autoentry of cytocapsulae in C. (E) Quantitation of the number of pseudopodia protrusions of acellular cytocapsulae and repulsed cells in C. (Scale bars: 10 µm.)

