Fig. 3.
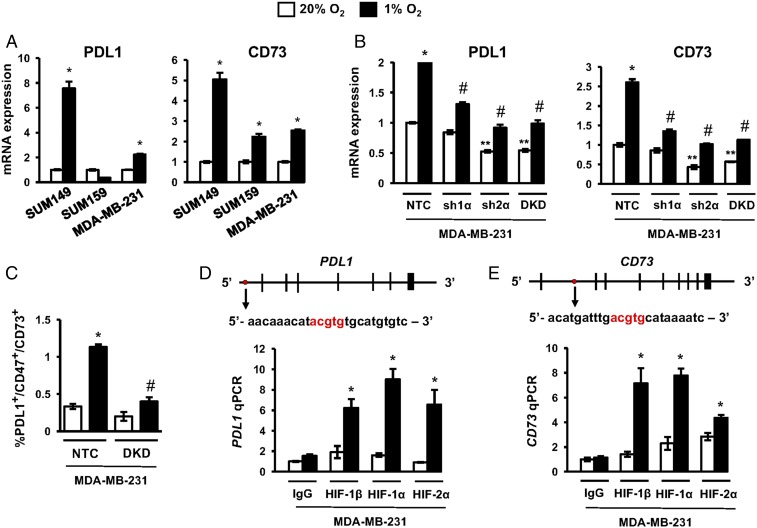
HIFs transactivate the PDL1 and CD73 genes. (A) TNBC cell lines were exposed to 20% or 1% O2 for 24 h, and the expression of mRNAs encoding PDL1 (Left) and CD73 (Right) was analyzed by RT-qPCR. The expression of each mRNA was quantified relative to 18S rRNA and then normalized to the result obtained from cells at 20% O2 (mean ± SEM; n = 3). *P < 0.01 versus 20% O2 (by two-way ANOVA with a Bonferroni posttest). (B) Analysis of PDL1 and CD73 mRNA expression in MDA-MB-231 subclones, which expressed an NTC shRNA or shRNA targeting HIF-1α (sh1α), HIF-2α (sh2α), or both HIF-1α and HIF-2α (DKD). Cells were exposed to 20% or 1% O2 for 24 h. Data were normalized to NTC at 20% O2 (mean ± SEM; n = 3). *P < 0.01 versus NTC at 20% O2; **P < 0.01 versus NTC at 20% O2; #P < 0.001 versus NTC at 1% O2 (by two-way ANOVA with a Bonferroni posttest). (C) MDA-MB-231 subclones were exposed to 20% or 1% O2 for 72 h, and the percentage of triple-positive cells was determined by flow cytometry (mean ± SEM; n = 3). *P < 0.01 versus NTC at 20% O2; #P < 0.001 versus NTC at 1% O2 (by two-way ANOVA with a Bonferroni posttest). (D and E) MDA-MB-231 cells were exposed to 20% or 1% O2 for 24 h and chromatin immunoprecipitation assays were performed using IgG or antibodies against HIF-1α, HIF-1β, or HIF-2α. Primers flanking the candidate HIF binding sites were used for qPCR, and results were normalized to lane 1 (mean ± SEM; n = 3). *P < 0.05 versus 20% O2 (by one-way ANOVA with a Bonferroni posttest). The nucleotide sequence (noncoding strand) of HIF binding sites (in red), which are located 5.7 kb 5′ to the transcription start site of the PDL1 gene (D) and within intron 1 of the CD73 gene (E), respectively, are shown. Exons and introns are not drawn to scale.

