Fig. 4.
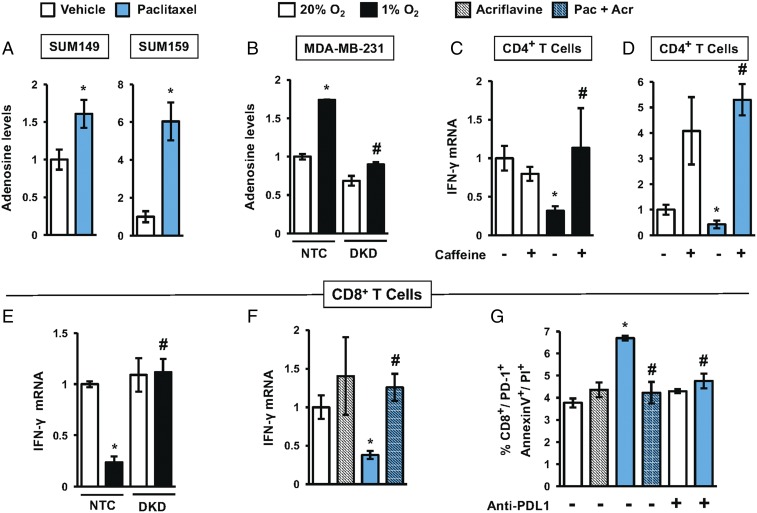
Exposure of TNBC cells to chemotherapy or hypoxia enables evasion of antitumor T cells. (A) Adenosine levels were measured in CM of SUM149 and SUM159 cells treated with paclitaxel (5 nM for SUM149 and 10 nM for SUM159) for 4 d. The values were corrected for cell number at the end of the experiment and then normalized to vehicle-treated cells (mean ± SEM; n = 3). *P < 0.05 versus vehicle (by Student’s t test). (B) Adenosine levels were measured in CM of MDA-MB-231 NTC and DKD subclones exposed to 20% or 1% O2 for 72 h. The values were normalized to NTC at 20% O2 (mean ± SEM; n = 3). *P < 0.05 versus NTC at 20% O2; #P < 0.05 versus NTC at 1% O2 (by two-way ANOVA with a Bonferroni posttest). (C and D) IFN-γ mRNA levels were determined (mean ± SEM; n = 3) in activated CD4+ T cells incubated for 24 h with CM (from hypoxic or paclitaxel-treated TNBCs) in the presence or absence of 4 mM caffeine. *P < 0.05 versus NTC at 20% O2; #P < 0.05 versus NTC at 1% O2 (by two-way ANOVA with a Bonferroni posttest). (E) IFN-γ mRNA levels (mean ± SEM; n = 3) were determined in activated CD8+ T cells cultured with CM from MDA-MB-231 subclones exposed to 20% or 1% O2 for 24 h. *P < 0.05 versus NTC at 20% O2; #P < 0.05 versus NTC at 1% O2 (by two-way ANOVA with a Bonferroni posttest). (F) IFN-γ mRNA levels (mean ± SEM; n = 3) were determined in activated CD8+ T cells incubated for 24 h with CM (from TNBC cells exposed to paclitaxel with or without 2 μM acriflavine for 4 d). *P < 0.05 versus vehicle-treated cells; #P < 0.05 versus paclitaxel-treated cells (by one-way ANOVA with a Bonferroni posttest). (G) CD8+ T cells were incubated with 4T1 cells (which were pretreated for 4 d with vehicle, acriflavine, paclitaxel, or paclitaxel + acriflavine) in presence or absence of anti-PDL1 blocking antibody. Cell death was assessed by staining with Annexin V and PI. The percentage of CD8+/PD1+ cells that were Annexin V+ and PI+ was quantified by flow cytometry (mean ± SEM; n = 3). *P < 0.05 versus vehicle-treated cells; #P < 0.05 versus paclitaxel-treated cells (by two-way ANOVA with a Bonferroni posttest).

