Fig. 3.
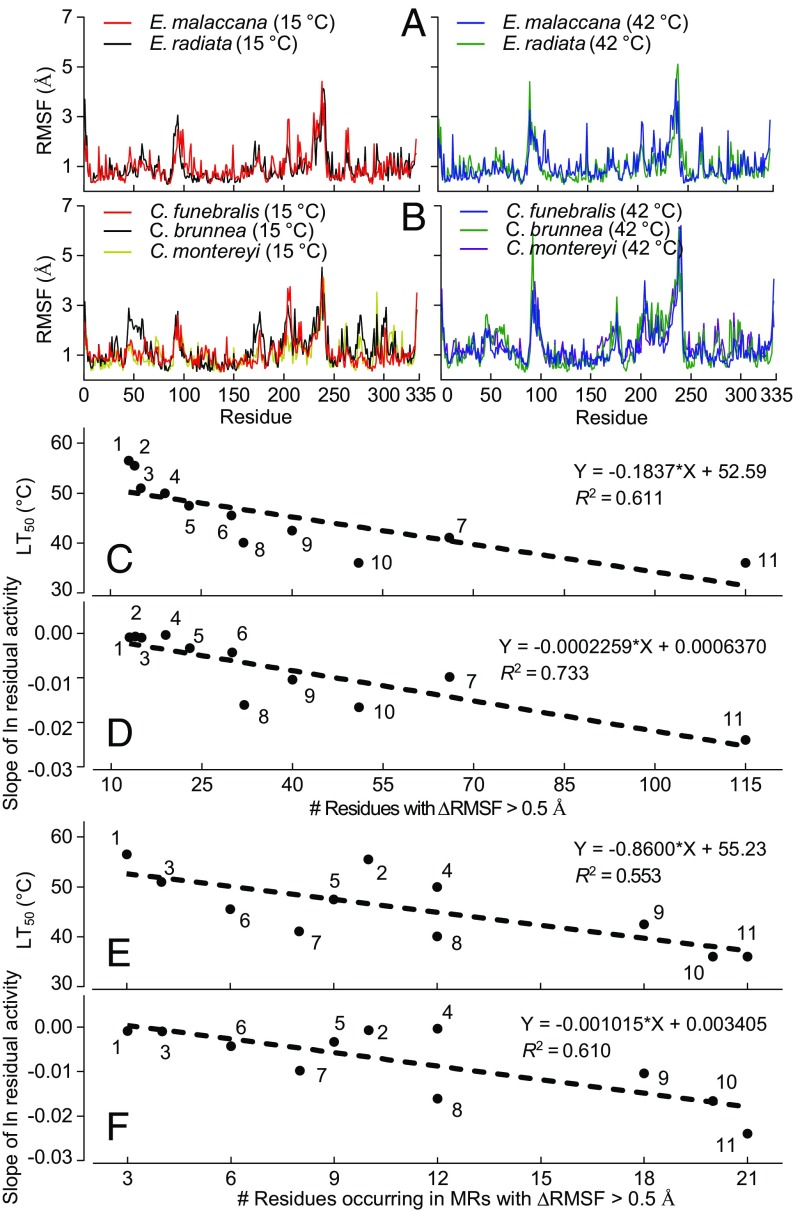
MDS analysis of side chain movements (RMSF) in molluscan cMDHs. RMSF spectra for congeners of Echinolittorina (A) and Chlorostoma (B) at simulation temperatures of 15 and 42 °C (n = 3). Values for average RMSF across the full sequence are given in Table S1. (C and D) Number of residues showing a change in RMSF (ΔRMSF) > 0.5 Å vs. the species’ lethal temperature (LT50) (C) and the rate of thermal denaturation (D) for the cMDH orthologs. (E and F) Number of residues occurring in MR regions (residues 90–105 and 230–245) showing ΔRMSF > 0.5 Å vs. LT50 (E) and the rate of thermal denaturation (F) for the cMDH orthologs. The numbers assigned to each species are given in the Fig. 2 legend. The relationships between the number of residues showing significant change and the LT50 or rate of thermal denaturation were analyzed by least-squares linear regression.

