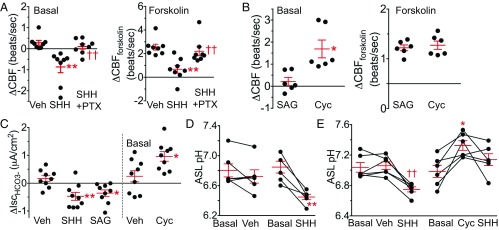
Fig. 5.
Apical SHH reduces CBF and ASL pH. Each set of data points is from a different donor. Bars and whiskers indicate mean ± SEM. (A) Change in CBF following addition of vehicle, SHH (263 nM), and SHH plus PTX (1.7 nM) under basal conditions (Left). Data (Right) are change in CBF produced by addition of forskolin (10 μM) and IBMX (100 μM) in presence of vehicle, SHH, or SHH plus PTX. Each data point is average of two to four cells. n = 8. **P < 0.01 vs. vehicle and ††P < 0.01 compared with SHH by one-way repeated-measures ANOVA with Sidak multiple-comparison posttest. (B) Change in CBF after addition of vehicle or cyclopamine-KAAD (250 nM) (Left). Data (Right) are change in CBF produced by addition of forskolin (5 μM) and IBMX (100 μM) in the presence of vehicle or cyclopamine-KAAD. Each data point is average of two to four cells. n = 6. *P < 0.05 vs. vehicle by paired Student’s t test. (C) Change in HCO3− secretion measured as short-circuit current (∆IscHCO3-) with addition of vehicle, SHH (53 nM), and SAG (200 nM). Data on Left, n = 9, **P < 0.01 and *P < 0.05 vs. vehicle by one-way repeated-measures ANOVA with Sidak multiple-comparison posttest. Data (Right) are from a different set of airway epithelia treated with vehicle or cyclopamine-KAAD (250 nM), n = 9, *P < 0.05 by paired Student’s t test. (D) ASL pH measured before (basal) and 30 min after addition of vehicle or SHH (53 nM). Connecting lines indicate paired epithelia from an individual donor. n = 6, **P < 0.01 compared with basal by paired Student’s t test. (E) ASL pH measured before and 45 min after addition of vehicle or cyclopamine-KAAD (250 nM) followed by addition of SHH. n = 6, *P < 0.05 compared with basal and ††P < 0.01 compared with vehicle, both by one-way repeated measures ANOVA with Sidak multiple-comparison posttest.

