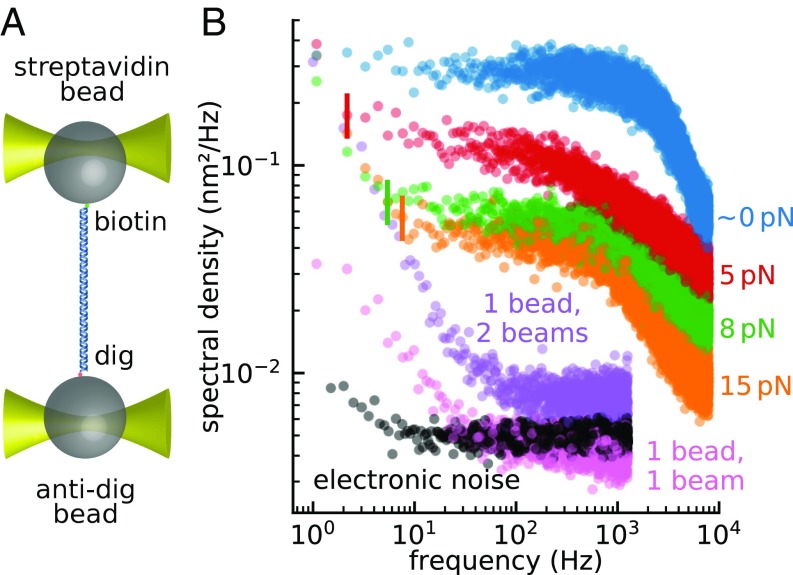
Fig. 2.
Measurement of the noise in a split-path instrument. (A) Two 1-µm beads were tethered by 1 kb DNA, using biotin–streptavidin linkage on one bead and digoxigenin–antidigoxigenin on the other. The beads were trapped using a split-path dual trap. (B) Power spectra of the differential signal were recorded while the tether was held under various tensions: ∼0 pN (blue), 5 pN (red), 8 pN (green), and 15 pN (orange). The vertical lines indicate the frequencies below which a non-Lorentzian component emerges from the Brownian floor. The purple curve shows the power spectrum of the differential signal from a single bead trapped with both trapping beams. The single-bead measurement measures relative drift between the two optical traps as well as contributions from bead-related artifacts (pink) and electronic noise (black).

