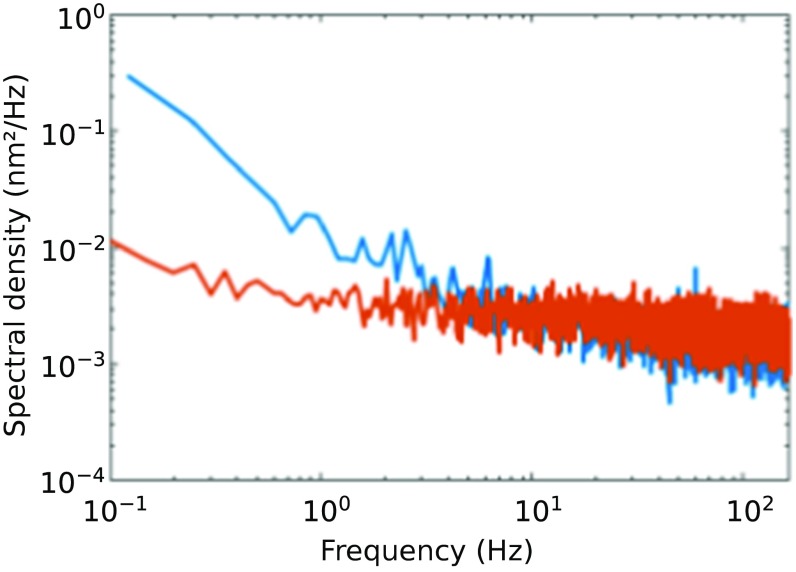
Fig. 4.
Power spectra of a split-path (blue) and a time-shared (red) instrument obtained monitoring the extension of a 3.5-kb DNA tether held at 5 pN of tension. 1/f noise dominates at low frequencies, especially in the split-path instrument. Only the portion of the spectra below the corner frequency (f < fc) is shown.

