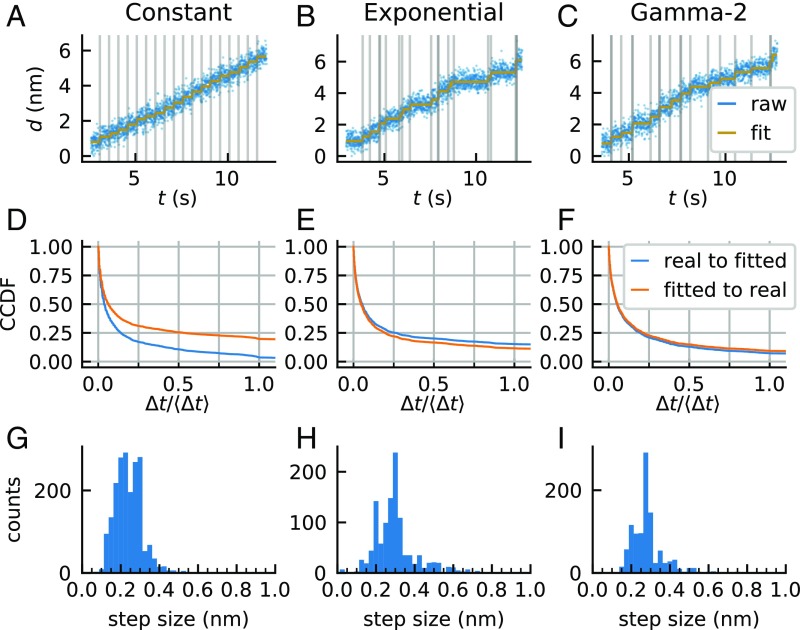
Fig. 5.
Collection and analysis of STEPS data. (A–C) Traps holding tethered beads were displaced away from each other by 0.34 nm at times separated by (A) constant, (B) exponentially distributed, or (C) gamma-2 distributed dwells, in each case with a mean dwell time of Δt = 0.5 s (blue, differential signal at 200 Hz; gray vertical lines, times of actual trap motion), and fitted by VSS-HMM without knowledge of the step size or the stepping times (gold, result of the fit). Good agreement between fitted times and actual trap motion can be observed. (D–F) Blue, complementary cumulative distributions of the time intervals between each real step and the closest fitted step, with the constraint that two real steps may not be associated with the same fitted step. Orange, complementary cumulative distributions of the time intervals between each fitted step and the closest real step, with the constraint that two fitted steps may not be associated with the same real step. The time axis is in units of mean dwell time (〈Δt〉 = 0.5 s). (D) Constant, (E) exponentially distributed, and (F) gamma-2 distributed dwells (SI Materials and Methods, Quantification of the Accuracy of the Fit for STEPS Data). (G–I) Step size distribution in the three cases. (G) Constant, (H) exponentially distributed, and (I) gamma-2 distributed dwells.

