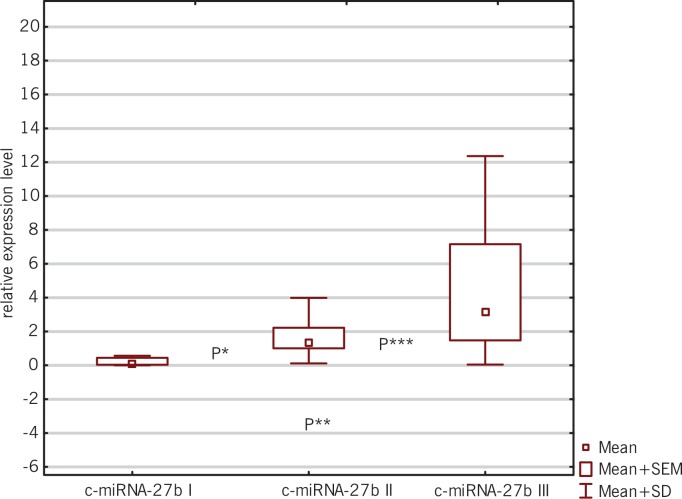
FIG. 1.
Box-and-whisker plots representing the expression levels (mean RQ) of c-miRNA-27b at three time points (I-III).
P* = 0.0098; between the first and second time point for c-miRNA-27b
P**=0.0003; between the first and third time point for c-miRNA-27b
P***=0.0016; between the second and third time point for c-miRNA-27b

