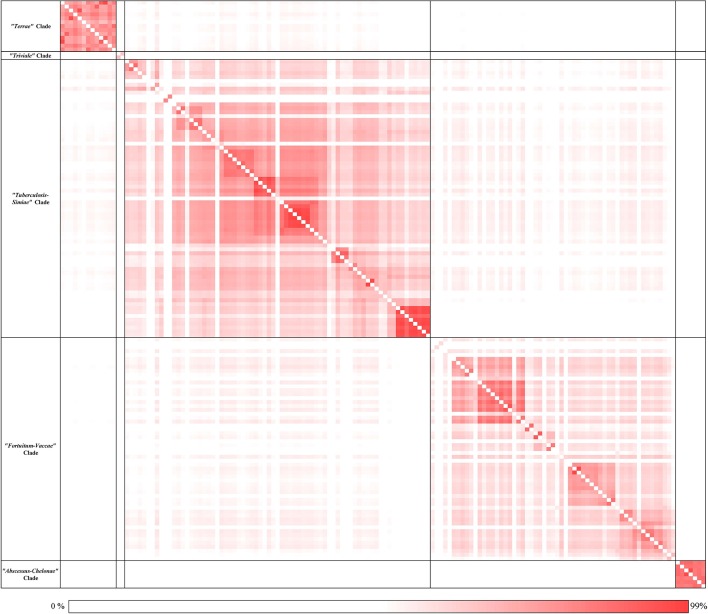
Figure 2.
A matrix of the average Amino Acid Identity for the 150 Mycobacterium genomes used in this study. A darker shade represents higher similarity between the pair of genomes. The average amino acid identity between each pair of genomes was calculated as described in the Methods section. The numerical values underlying this matrix are provided in Supplementary Figure 3.

