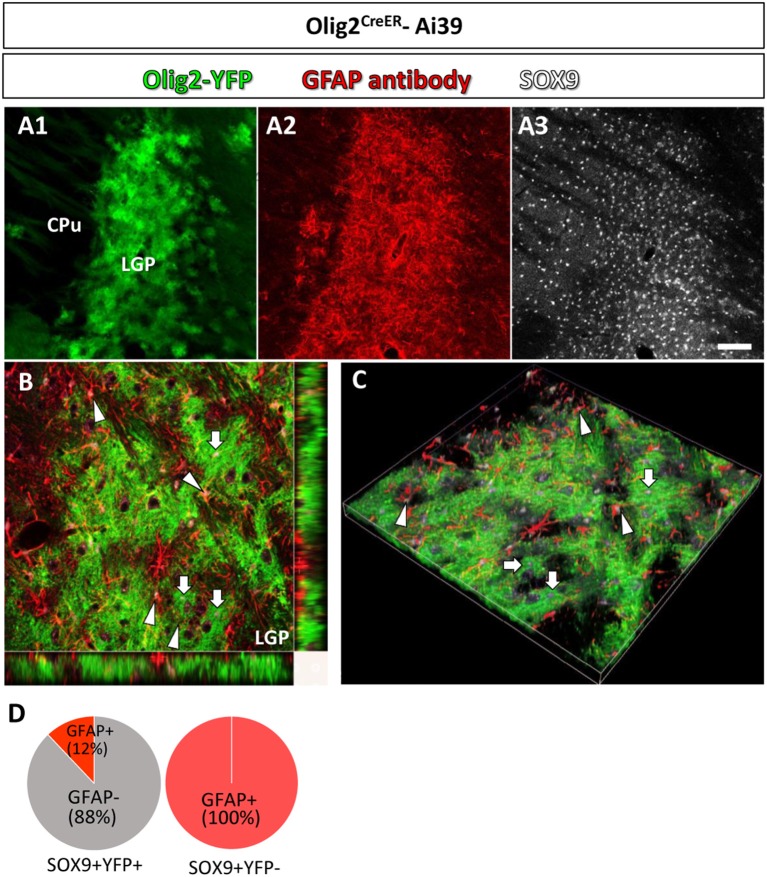
Figure 3.
Olig2-AS and GFAP-immunoreactive astrocytes show differential localization in a single brain nucleus. In a low-magnification view, Olig2-AS (in green fluorescence) and GFAP-immunolabeled astrocytes (in red fluorescence) were densely localized in the LGP (A1,A2, respectively) and SOX9 immunoreactive astrocytes were more widely distributed in CPu and LGP (A3). (B) The orthogonal views (x-y, y-z, and x-z planes) revealed that SOX9 positive Olig2-AS (arrows) and SOX9 positive GFAP-expressing astrocytes (arrowheads) occupied adjacent but non-overlapping territories in the LGP. (C) The z-stack 3D images of the same area of (B). (D) Semi-quantitative analyses revealed that 88% (204/232, n = 3) of SOX9-positive YFP-positive Olig2-AS were GFAP-negative and 12% (28/232, n = 3) of them co-expressed GFAP. All the SOX9-positive YFP-negative cells in the LGP were positive for GFAP (281/281, n = 3). Scale bar (A3, for A1,A2): 100 μm.

