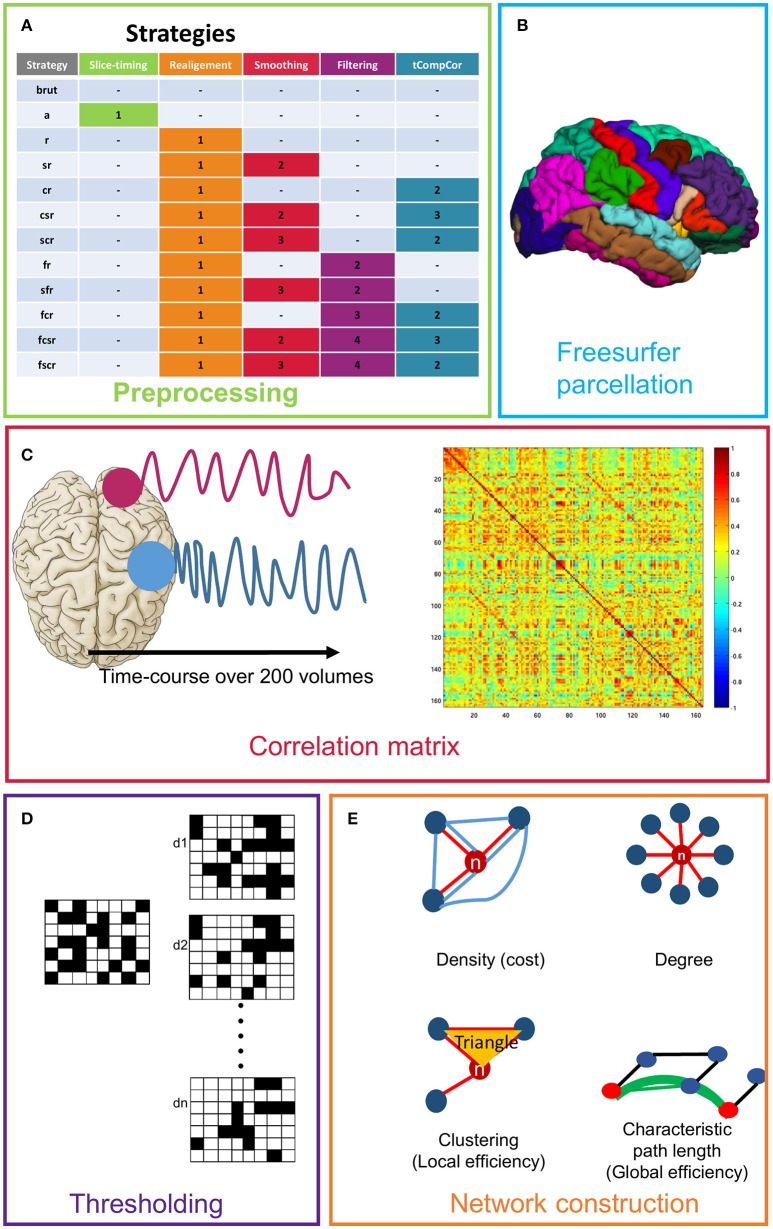
Figure 1.
Presentation of the different steps used for network creation and definition of the different strategies. (A) Presentation of all strategies (we defined the order of application of each step). (B) Freesurfer parcellation (only the cortical regions are shown). (C) Time course calculation and example of a correlation matrix. (D) Simulation of the thresholding of the correlation matrix over a range of density (d1,.dn). (E) Representative diagram of the used graph theory measures.

