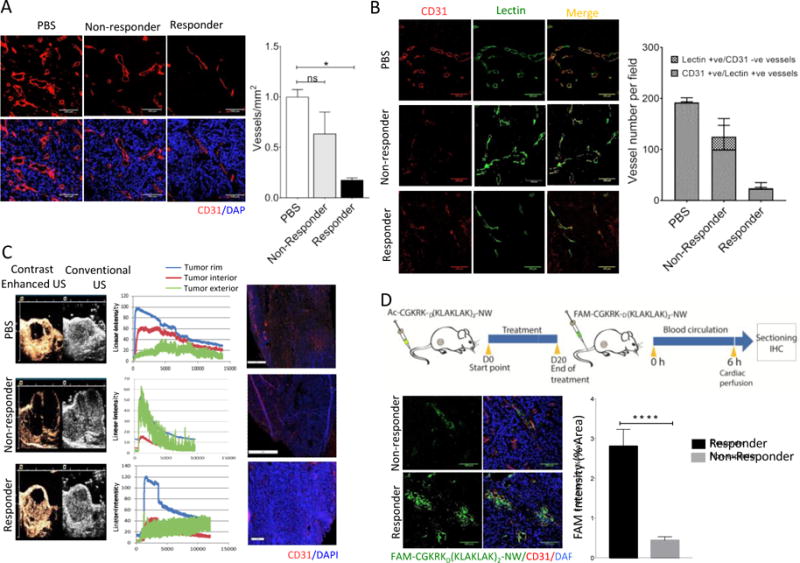
Figure 2. Vascular changes in responder and non-responder tumors.

(A) Representative confocal images of tumor vasculature stained with anti-CD31 (red). CD31-positive blood vessels were quantified by counting 10 random fields at 20× magnification, and the results are presented as number of vessels per field (***P < 0.001, one way ANOVA, Tukey’s posthoc test, n = 3 mice per group, scale bar = 100μm). (B) Blood vessel density estimated by anti-mouse CD31 staining (red) and lectin (green) perfusion. Representative images from 3 mice analyzed in each group are shown. Blood vessels were quantified and analyzed as described for panel A, n = 3 mice per group, scale bar = 100 μm). (C) Tumor-bearing mice were treated as in Figure 1, and at the end of the treatment, blood flow in control and treated tumors was measured by contrast-enhanced ultrasound. The grey images outline the entire tumor; the brown color images show the blood flow. Graph is showing enhancement-analysis curves of blood flow in different tumor regions and the surrounding tissue. (D) Schematic representation of a homing experiment. Tumor-bearing mice were treated with the nanosystem for three weeks, and at the end of the treatment, FAM-labeled peptide-NWs were intravenously injected (5mg iron/kg) and allowed to circulate for 5 hours. The mice were perfused through the heart with PBS, and tumors and organs were collected and processed for fluorescence microscopy. Tumor sections were stained with anti-CD31 and examined by confocal microscopy. NWs, green; blood vessels (CD31), red; DAPI-stained nuclei, blue. (Scale bars, 100μm). Bar diagram, quantification of NW accumulation in tumors. Slides were scanned using Scanscope. NW fluorescence in 10 random areas of each tumor section (n = 3/group) was quantified using ImageJ software. (****P < 0.0001, paired t test, n = 3 mice per group, Error bars = mean ±SD).
