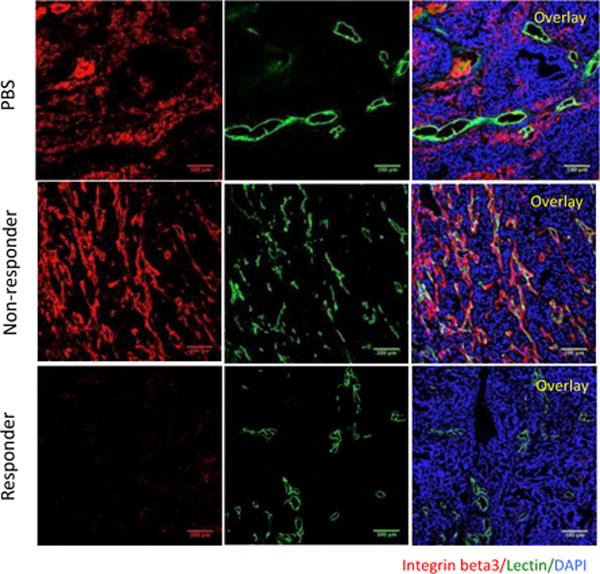
Figure 5. Integrin β3 expression in treated tumors.

(A) Tumor sections were stained with anti-β3 integrin antibodies (red) and examined by confocal microscopy. Lectin, green; β3, red; DAPI-stained nuclei, blue. (Scale bars, 100 μm).

(A) Tumor sections were stained with anti-β3 integrin antibodies (red) and examined by confocal microscopy. Lectin, green; β3, red; DAPI-stained nuclei, blue. (Scale bars, 100 μm).