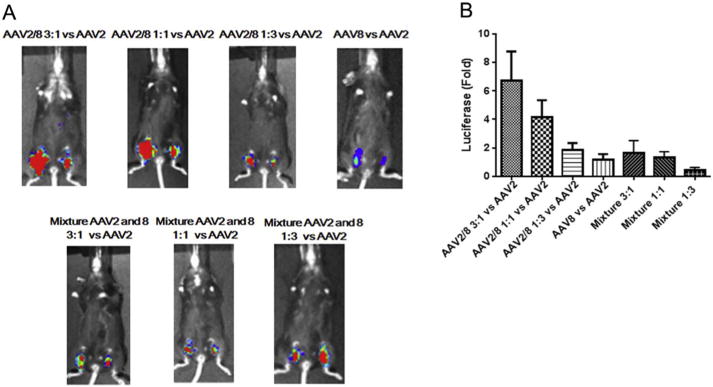
Fig. 2.

Transduction of the haploid viruses in mouse muscle. 1 × 10¹⁰ vg of the haploid viruses, parental viruses or viruses mixed with AAV2 and AAV8 were injected into C57 BL/6 mice via direct muscular injection. Each group included 4 mice. (A) After one week, luciferase gene expression was imaged by IVIS imaging system. (B) The photon signal was measured and calculated. The data represents an average of luciferase gene expression values for the 4 injected mice in each group, with the standard deviation indicated by an error bar. Face up: left leg-AAV8 or haploid or mixture viruses, right leg-AAV2.
