Figure 1.

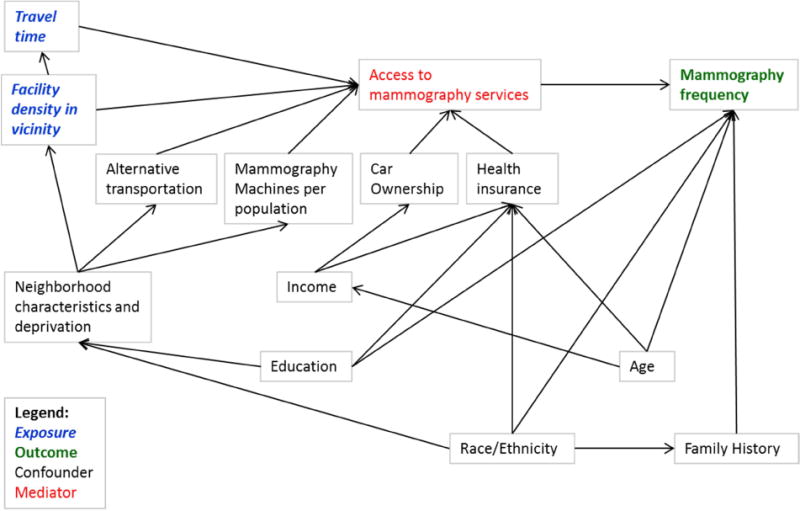
Directed Acyclic Graph of the associations between driving time and mammography facility density within residential neighborhood, and frequency of mammography screening use

Directed Acyclic Graph of the associations between driving time and mammography facility density within residential neighborhood, and frequency of mammography screening use