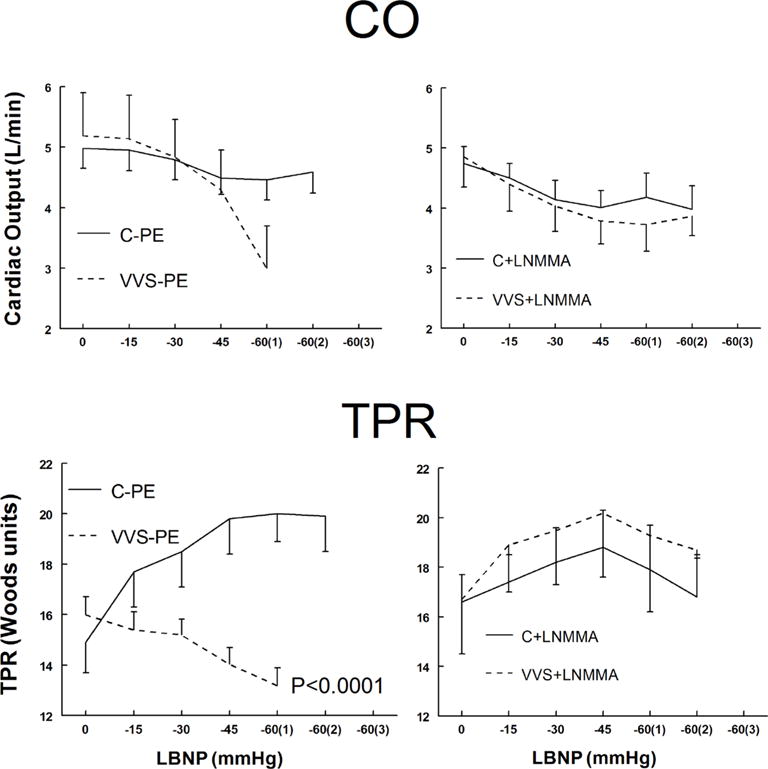
Figure 2.

Cardiac output (CO), upper panels, and total peripheral resistance (TPR), lower panels, during lower body negative pressure (LBNP) for control subjects (solid lines) and vasovagal syncope (VVS) subjects (dashed lines). Saline and low dose phenylephrine (PE) were infused to simulate the fluid volume and maintained (left panels) to assure that heart rate (HR) and mean arterial pressure (MAP) were similar to HR and MAP in each subject after loading NG-monomethyl-L-arginine (L-NMMA) (right panels). This is depicted as Saline+PE and is shown for control subjects (C–PE), control subjects who received L-NMMA (C+LNMMA), patients with VVS who received saline and PE (VVS-PE) and patients with VVS who received L-NMMA (VVS+LNMMA). Following that, increasingly negative LBNP was applied. p<0.0001 represents a significant difference in the group by pressure interaction effect.
