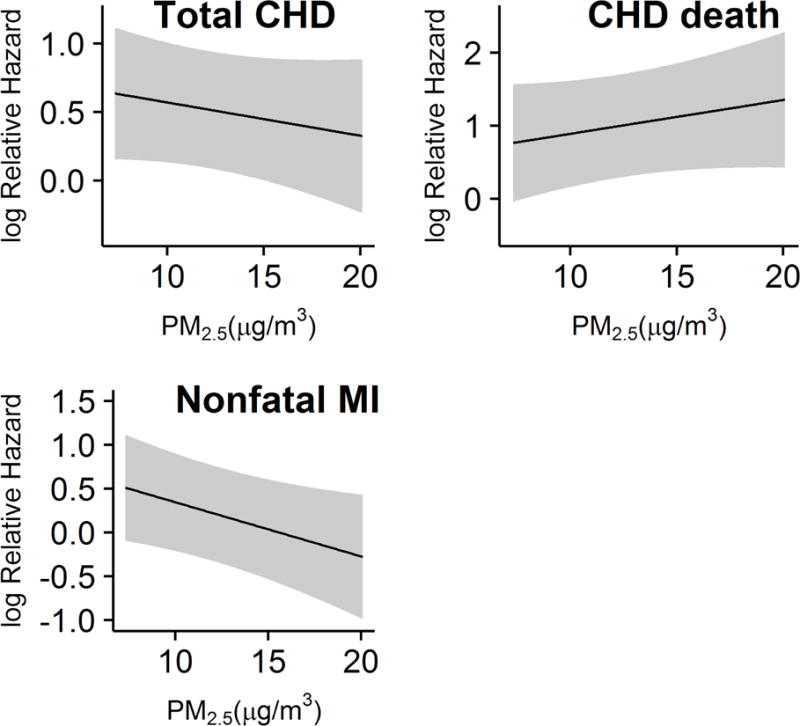
Figure 2. Predicted log hazard for incident total CHD, CHD death, and nonfatal MI versus previous 1-year mean ambient PM2.5 concentration.

Grey bands are 95% prediction intervals. In models that included an interaction between PM2.5 and risk factor burden, the interaction was not statistically significant for total CHD (p = 0.44), for CHD death (p = 0.47), nor for nonfatal MI (p = 0.09). In models for total CHD, sensitivity analyses did not identify statistically significant interactions between PM2.5 exposure and gender (p = 0.998), race (p = 0.85), or urbanicity (p = 0.40). None of these interactions were significant for either CHD death or nonfatal MI (data not shown).
