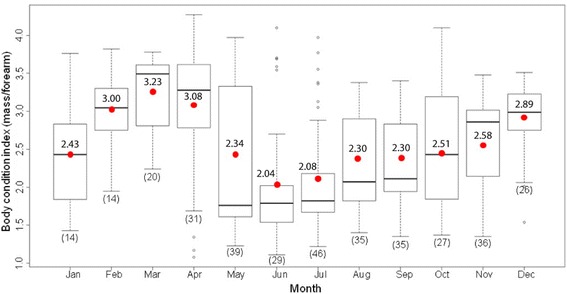
Fig. 1.

Body condition indices (BCI) of 352 bats captured in the study from January to December 2012. Bats were captured monthly at three sites (S1-S3). Numbers in brackets indicate sample size from 3 sites. Boxes depict the 25th and 75th percentiles, lines within boxes mark the median, red spot and number represent mean, whiskers represents minimum and maximum values, and circles indicates outliers
