
Fig. 2.
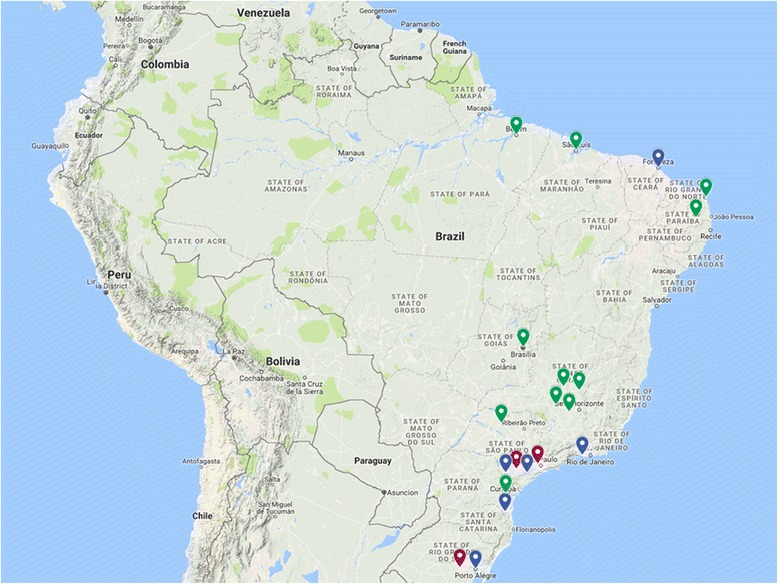
Location of centres participating in the study. Transplant activity is indicated in colour, as follows: Red, high activity (> 150 kidney KTs/year); green, moderate activity (50 to 150 KTs/year); blue, low activity (< 50 KTs/year)
Official websites use .gov
A
.gov website belongs to an official
government organization in the United States.
Secure .gov websites use HTTPS
A lock (
) or https:// means you've safely
connected to the .gov website. Share sensitive
information only on official, secure websites.
Location of centres participating in the study. Transplant activity is indicated in colour, as follows: Red, high activity (> 150 kidney KTs/year); green, moderate activity (50 to 150 KTs/year); blue, low activity (< 50 KTs/year)