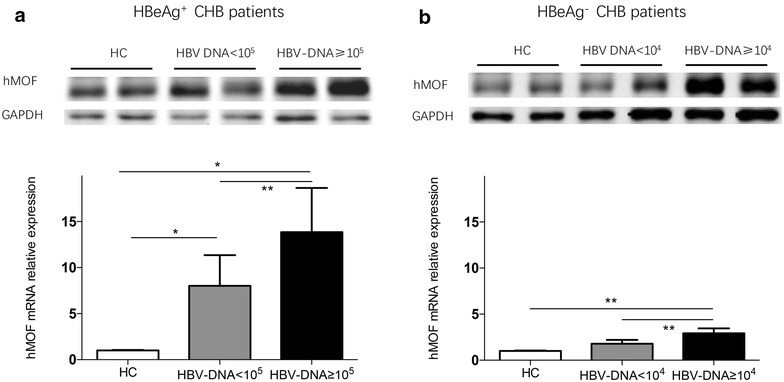
Fig. 2.

Hepatic hMOF in HBeAg+ and/or HBeAg− CHB patients and healthy controls. Hepatic hMOF production was presented with Western blot and quantitative analysis of hepatic hMOF mRNA expression was measured by qPCR, from HBeAg+ CHB patients (a) and HBeAg− CHB with high HBV DNA load (HBV DNA ≥ 105 IU/mL, 10 cases) and with low HBV DNA load (HBV DNA < 105 IU/mL, 10 cases), and healthy controls (HC) (three cases), and HBeAg− CHB (b) with high HBV DNA load (HBV DNA ≥ 104 IU/mL, 10 cases) and with low HBV DNA load (HBV DNA < 104 IU/mL, 10 cases), and healthy controls (HC) (three cases). The significant difference is expressed as *p < 0.05, **p < 0.01
