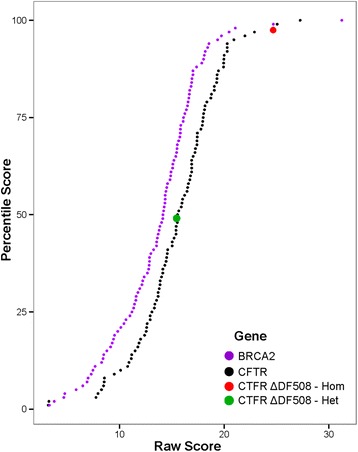
Fig. 1.

CRD curves normalize raw scores across genes. VVP raw score CRD curves for BRCA2 (purple), and CFTR (black), respectively. Note that a given CFTR raw score achieves a lower percentile score than does the same raw score for BRCA2. Red and green dots correspond to the canonical pathogenic CFTR variant ΔF508 scored as a homozygote and heterozygote, respectively
